Earth Right Now | September 26, 2016
Watching our climate 100 miles from shore
Baffin Island, specifically, the largest island in Canada.
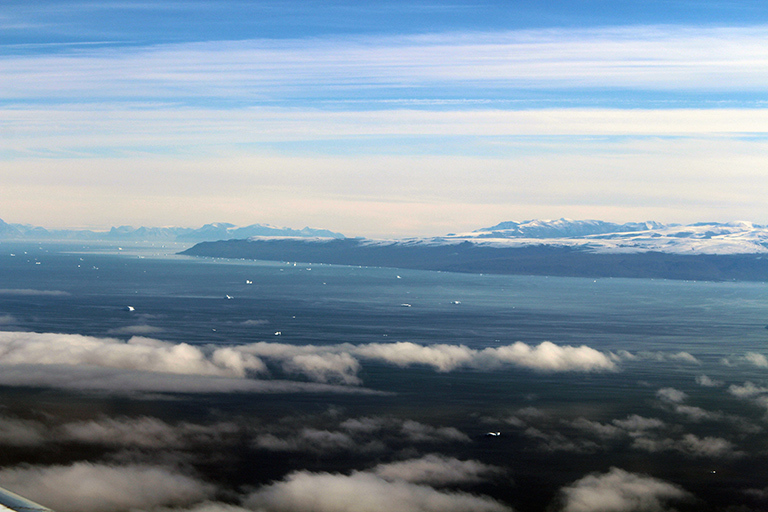
“What are we doing all the way out here?” I thought. If I looked out the left side of NASA’s modified G-III aircraft, I could see Canada out the window—Baffin Island, specifically, the largest island in Canada, part of its northeast territory. And if I looked out the right side, I could see the west coast of Greenland. We were pretty much halfway between the two, right in the middle of Baffin Bay, and I was surprised.
At a glacial pace
I went over to where Flight Engineer Terry Lee kept the map of all the scheduled drop positions and stared at it for a while. She’d marked with a green highlighter the places where she’d already released science probes through a tube in the bottom of the plane. (Hahahah, yes! There’s a hole in the plane through which Aircraft eXpendable Conductivity Temperature Depth (AXCTD) probes leave the aircraft to travel 5,000 feet down to the sea surface and then another 1,000 meters into the ocean, sending back data as they go.)
And even though I’d seen this map before, the yellow dots representing scheduled probe drops were right in front of me, out in the middle of the sea, about 100 miles off the coastline. And that confused me because I presumed that this location, this far out at sea, wouldn’t have a layer of fresh water at the sea surface. I figured this far out we’d find salty 3- to 4-degree North Atlantic Ocean Water at the sea surface. So why weren’t we closer to shore where the land ice was melting?I looked out the window as we flew on. Icebergs dotted the seascape. Each one had once been part of a vast ice sheet that’s been around for hundreds of thousands of years. Each one had moved – at a glacial pace, mind you – from the interior, down through one of the many fjords that slice through the Greenland coastline, and finally out to sea, where they would ultimately melt away. The ‘bergs were large, and it was fun to fly over them and look at their perfect whiteness against the stunning blue sea. All of us would gather on one side of the plane as we passed over a ‘berg, and then quickly jump to the other side to look for it again as we passed by it. But even though there were hundreds of icebergs floating around out there, Baffin Bay is vast — more than 250 thousand square miles. So, in the grand scheme of things, the icebergs seemed inconsequential, incapable of affecting the ocean salinity more than a small amount.
Real-time data
I was in the midst of pondering all this, not wanting to bother any of the busy team members, when Oceans Melting Greenland Project Manager Steve Dinardo called me over to the bank of computer monitors where he was working. He motioned for me to trade headsets. After I gave him mine and I put on his, I could hear the AXCTD probe sending its signal to the plane as it descended through the water column, and the noise reminded me of the sound a Wookiee from Star Wars makes.As I was listening, I could see temperature and salinity values arriving in real-time on the monitor. “Wow, no way!” I exclaimed. “That’s insane.” All the way in the middle of Baffin Bay, 100 miles offshore, the ocean was fresher on the surface. I watched the salinity values increase as the probe sank. The temperature profile also reflected a scenario of near-zero-degree water at the surface with 3- to 4-degree ocean water below. That upper layer is Arctic Ocean Water, which is way less salty than the warmer North Atlantic Ocean Water that lies beneath it.
And this is the whole point of NASA’s Oceans Melting Greenland mission—to find out how far that warmer North Atlantic Ocean Water has penetrated. Knowing this will help us measure the quantity and rate at which the warmer North Atlantic Ocean Water is melting the Greenland Ice Sheet.I walked back to look at the yellow dots on the map of the scheduled probe drops one more time. We were as far away from the coast as we would be; the rest of the drops were closer to shore. I wondered how the temperature and salinity profiles in the coastal waters would compare to those from the open ocean.
And the point of the mission flooded my mind again. I looked out the window, across the stretch of Baffin Bay at the Greenland coastline, where groups of icebergs dotted the horizon. In this vast expanse, no one’s done this before, no one knows what this ocean water is like, and we are about to find out.
Find out more about Oceans Melting Greenland.
View and download OMG animations and graphics.
Thank you for your comments.
Laura
TAGS: CLIMATE, OCEANS, MELTING, GREELAND, NASA, JET PROPULSION LABORATORY, JPL


