Teachable Moments | October 18, 2019
NASA's Eyes on Extreme Weather
In the News
An extreme weather event is something that falls outside the realm of normal weather patterns. It can range from superpowerful hurricanes to torrential downpours to extended hot dry weather and more. Extreme weather events are, themselves, troublesome, but the effects of such extremes, including damaging winds, floods, drought and wildfires, can be devastating.
NASA uses airborne and space-based platforms, in conjunction with those from the National Oceanic and Atmospheric Administration, or NOAA, to monitor these events and the ways in which our changing climate is contributing to them. Together, the agencies are collecting more detailed data on weather and climate than ever before, improving society's ability to predict, monitor and respond to extreme events.
NASA makes this data available to the public, and students can use it to understand extreme weather events happening in their regions, learn more about weather and climate in general, and design plans for resilience and mitigation. Read on for a look at the various kinds of extreme weather, how climate change is impacting them, and ways students can use NASA data to explore science for themselves.
How It Works
Global climate change, or the overall warming of our planet, has had observable effects on the environment. Glaciers have shrunk, ice on rivers and lakes is breaking up and melting earlier in the year, precipitation patterns have changed, plant and animal habitat ranges have shifted, and trees are flowering sooner, exposing fruit blossoms to damaging erratic spring hail and deadly late frost. Effects that scientists had predicted in the past are now occurring: loss of sea ice, accelerated sea level rise, shifting storm patterns and longer, more intense heat waves.
Some of the most visible and disruptive effects of global climate change are extreme weather and resulting disasters such as wildfires and flooding. These events vary by geographic location, with many regions, such as the Southwest United States and parts of Central and South America, Asia, Europe, Africa and Australia, experiencing more heat, drought and insect outbreaks that contribute to increased wildfires. Other regions of the world, including coastal areas of the United States and many island nations, are experiencing flooding and salt water intrusion into drinking water wells as a result of sea level rise and storm surges from intense tropical storms. And some areas of the world, such as the Midwestern and Southern United States, have been inundated with rain that has resulted in catastrophic flooding.
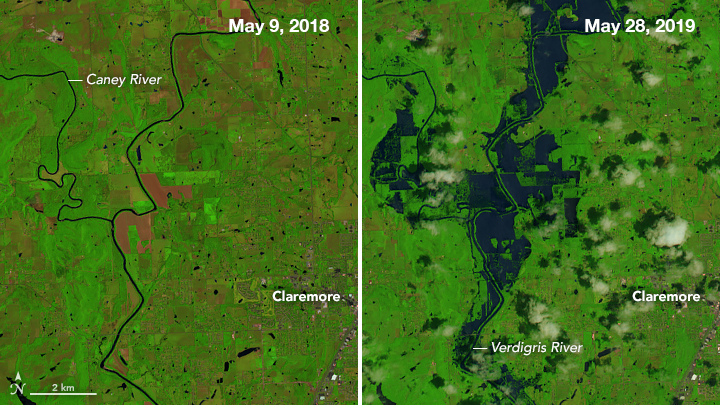
This pair of images shows the northeast side of Tulsa, Oklahoma, in May 2018 (left) and in May 2019 (right) after the Caney and Verdigris rivers flooded. Image credit: NASA/USGS | › Full image and caption
Temperatures, rainfall, droughts, high-intensity hurricanes and severe flooding events all are increasing and projected to continue as the world's climate warms, according to the National Climate Assessment. Weather is dynamic and various types of weather can interact to produce extreme outcomes. Here's how climate change can play a role in some of these weather extremes.
High Temperatures
This color-coded map displays a progression of changing global surface temperature anomalies from 1880 through 2018. Higher-than-normal temperatures are shown in red and lower-than-normal temperatures are shown in blue. The final frame represents the global temperatures five-year averaged from 2014 through 2018. Scale in degrees Celsius. Credit: NASA's Scientific Visualization Studio. Data provided by Robert B. Schmunk (NASA/GSFC GISS). | Watch on YouTube
Eighteen of the 19 warmest years on record have occurred since 2001. September 2019 tied as the hottest month on record for the planet. Since the 1880s, the average global surface temperature has risen about 2 degrees Fahrenheit (1 degree Celsius). As a result of warming temperatures, global average sea level has risen nearly 7 inches (178 millimeters) over the past 100 years. Data show this warming of the Earth system has been driven in large part by increased emissions into the atmosphere of carbon dioxide and other greenhouse gases created by human activities. And as temperatures continue to rise, we can expect more extreme weather.
Drought and Wildfires
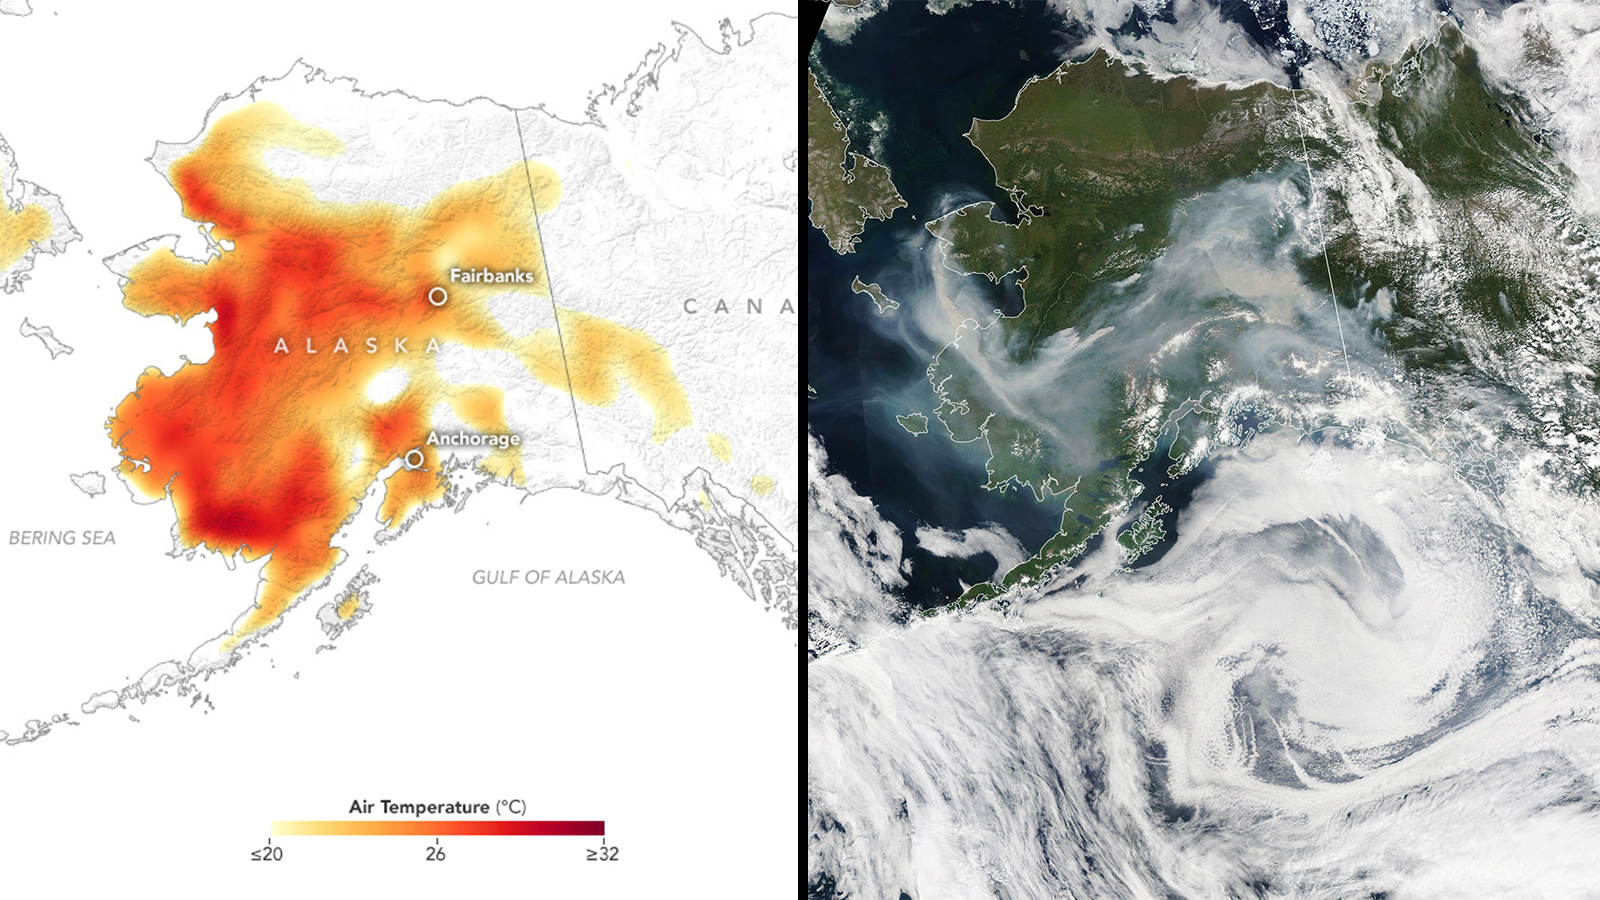
The image on the left shows air temperatures during a record-breaking June 2019 heat wave in Alaska. Around the same time, a cluster of lightning-triggered wildfires broke out in the same area. Smoke from the wildfires can be seen in the image on the right. Image credit: NASA | › Full image and caption
High temperatures alone can lead to drought. Drought can cause problems for humans, animals and crops dependent on water and can weaken trees, making them more susceptible to disease and insect attacks. High temperatures combined with low humidity, dry vegetation and hot, dry, fast winds typify what is known as "fire weather" or "fire season." During fire season, wildfires are more likely to start, spread rapidly and be difficult to extinguish.

The Operational Land Imager on the Landsat 8 satellite captured this image of the Walker Fire in Northern California on Sept. 8, 2019. Image credit: NASA/USGS | › Full image and caption
In California, where climate change has brought hotter, drier weather, residents are plagued by two fire seasons – one lasting from June through September that is primarily caused by high heat, low humidity and dry vegetation, and another lasting from October through April that is generally more volatile, as it is fueled by high winds. This 11-month fire season is longer than in past years. In recent years, California has also seen an increase in destructive wildfires. Weather extremes and climate change are partly to blame, even in relatively wet years. In California, these years mean more plant growth and potentially more fuel for fires when those plants dry out in the fall and the winds arrive. Wildfires have some fairly obvious effects on people and property. In addition to the visible destruction, smoke from wildfires can dramatically decrease air quality, pushing carbon into the air and destroying important carbon-sequestering plants and trees. Large-scale biomass destruction, as is happening in the Amazon rainforest, will have a lasting impact on important Earth processes.
Hurricanes

This image, acquired on October 11, 2019, by the Moderate Resolution Imaging Spectroradiometer, or MODIS, on NASA's Aqua satellite, shows Typhoon Hagibis as its outer cloud bands neared Japan. Image credit: NASA | › Full image and caption
Since the 1980s, regions of the world prone to hurricanes, cyclones and typhoons have witnessed an increase in intensity, frequency and duration of these destructive storms. All three are intense tropical storms that form over oceans. (The different names refer to where on Earth they occur.) They are all fueled by available heat energy from warm ocean water. Warmer oceans provide more energy to passing storms, meaning hurricanes can form more quickly and reach higher speeds. Typhoon Hagibis, which recently left a trail of destruction in Japan, was described as the worst storm to hit the region in decades. Growing unusually quickly from a tropical storm to a Category 5 storm in less than a day, Hagibis was so intense it was called a super typhoon. In 2018, the second strongest cyclone to hit a U.S. territory and the largest typhoon of the year, Super Typhoon Yutu, caused catastrophic destruction on the Mariana Islands, an archipelago in the North Pacific Ocean. More intense storms and rising sea levels make storm surge – ocean water that is pushed toward the shore by strong winds – even worse than in the past. Typhoons can wreak havoc on infrastructure and compromise fresh water reserves. It can take months or even years for a hard-hit region to recover.
Snowstorms

The MODIS instrument aboard NASA's Terra Satellite captured the low-pressure area near New England that brought heavy snows and thundersnow to the Mid-Atlantic and Northeastern U.S. in January 2011. Image credit: NASA Goddard/MODIS Rapid Response Team
Like any other weather event, extreme cold weather events such as blizzards and unusually heavy snowfall can be, but are not always, linked to climate change. Just as warmer ocean water increases the intensity of a warm tropical storm, warmer than average winter ocean temperatures in the Atlantic feed additional energy and moisture into cold storms, influencing the severity of snowfall once the storm comes ashore in the Eastern United States. There is some natural variability, such as the presence of El Niño conditions, that can also lead to severe snowstorms in the region. But natural variability isn't enough to fully explain the increase in major snowstorms in the U.S. In fact, the frequency of extreme snowstorms in the eastern two-thirds of the region has increased dramatically over the last century. Approximately twice as many extreme snowstorms occurred in the U.S. during the latter half of the 20th century as in the first half.
Why It's Important
Because of the risk to lives and property, monitoring the increasing number of extreme weather events is more important now than ever before. And a number of NASA satellites and airborne science instruments are doing just that.
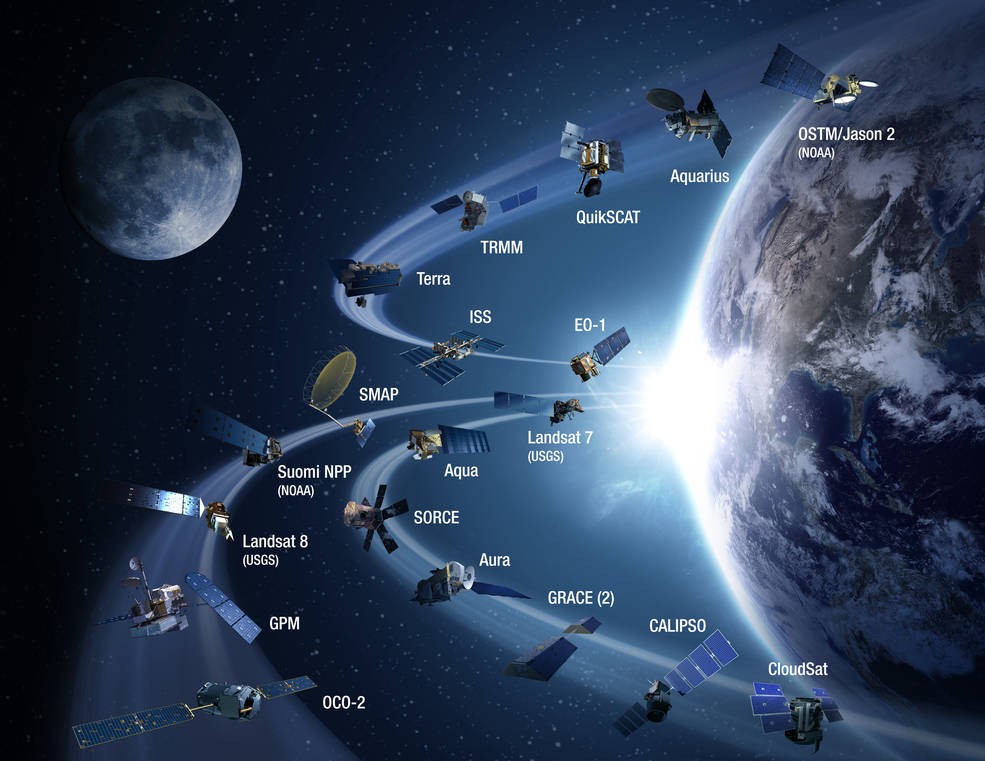
This graphic shows NASA's fleet of Earth-science satellites designed to monitor weather and climate across the globe. Image credit: NASA
A large global constellation of satellites, operated by NASA and NOAA, combined with a small fleet of planes operated by the U.S. Forest Service, help detect and map the extent, spread and impact of forest fires. As technology has advanced, so has the value of remote sensing, the science of scanning Earth from a distance using satellites and high-flying airplanes. Wildfire data from satellites and aircraft provide information that firefighters and command centers can use to call evacuation orders and make decisions about where to deploy crews to best arrest a fire's progress.
The agencies' satellites and airborne instruments also work in conjunction with those from international partners to provide data about hurricanes to decision makers at the National Hurricane Center, where predictions and warnings are issued so evacuations can be coordinated among the public and local authorities. Visible imagery from NASA satellites helps forecasters understand whether a storm is brewing or weakening based on changes to its structure. Other instruments on NASA satellites can measure sea surface characteristics, wind speeds, precipitation, and the height, thickness and inner structure of clouds.
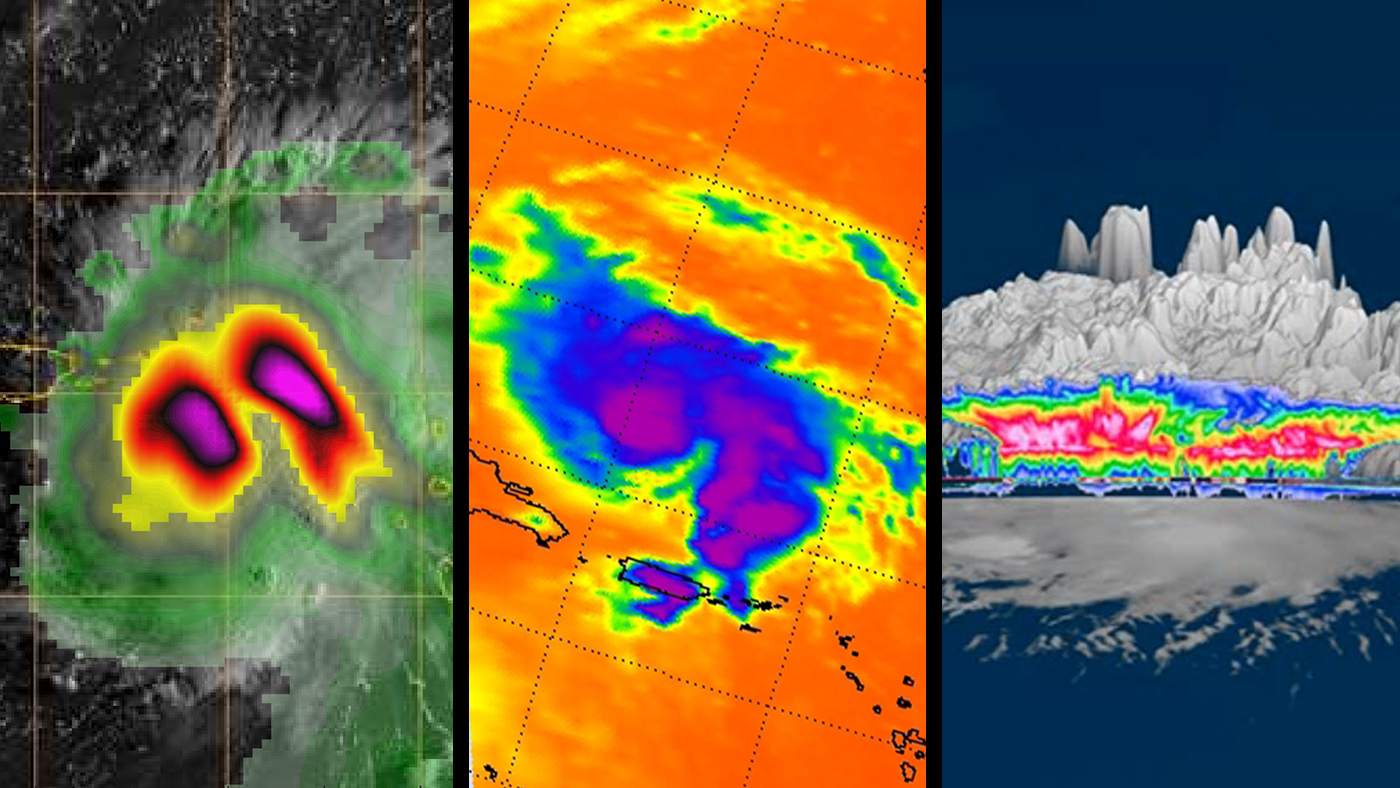
Three images of Hurricane Dorian, as seen by a trio of NASA's Earth-observing satellites in August 2019. The data sent by the spacecraft revealed in-depth views of the storm, including detailed heavy rain, cloud height and wind. Image credit: NASA/JPL-Caltech | › Full image and caption
NASA's airborne instruments, such as those aboard the Global Hawk aircraft, provide data from within the storm that cannot be otherwise obtained. Global Hawk can fly above a storm in a back-and-forth pattern and drop instruments called dropsondes through the storm. These instruments measure winds, temperature, pressure and humidity on their way to the surface. This detailed data can be used to characterize a storm, informing scientists of shifting patterns and potential future developments.
NASA missions will continue to study both weather and climate phenomena – whether they be droughts, floods, wildfires, hurricanes or other extremes – returning data for analysis. New airborne instruments aboard the satellite-simulating ER-2 and cloud-penetrating P-3 aircraft will fly missions starting in 2020 to study Atlantic coast-threatening snowstorms. Data from these flights will be combined with ground-based radar measurements and satellite measurements to better understand storms and their potential impact. Meanwhile, climate science instruments and satellites will continue to collect data that can inform everyone about the many aspects of our changing planet.
Teach It
Weather and climate data isn't just for meteorologists. Explore the resources and standards-aligned lessons below to get students analyzing local weather patterns, understanding wildfire monitoring and modeling global climate!
Precipitation and Clouds
-
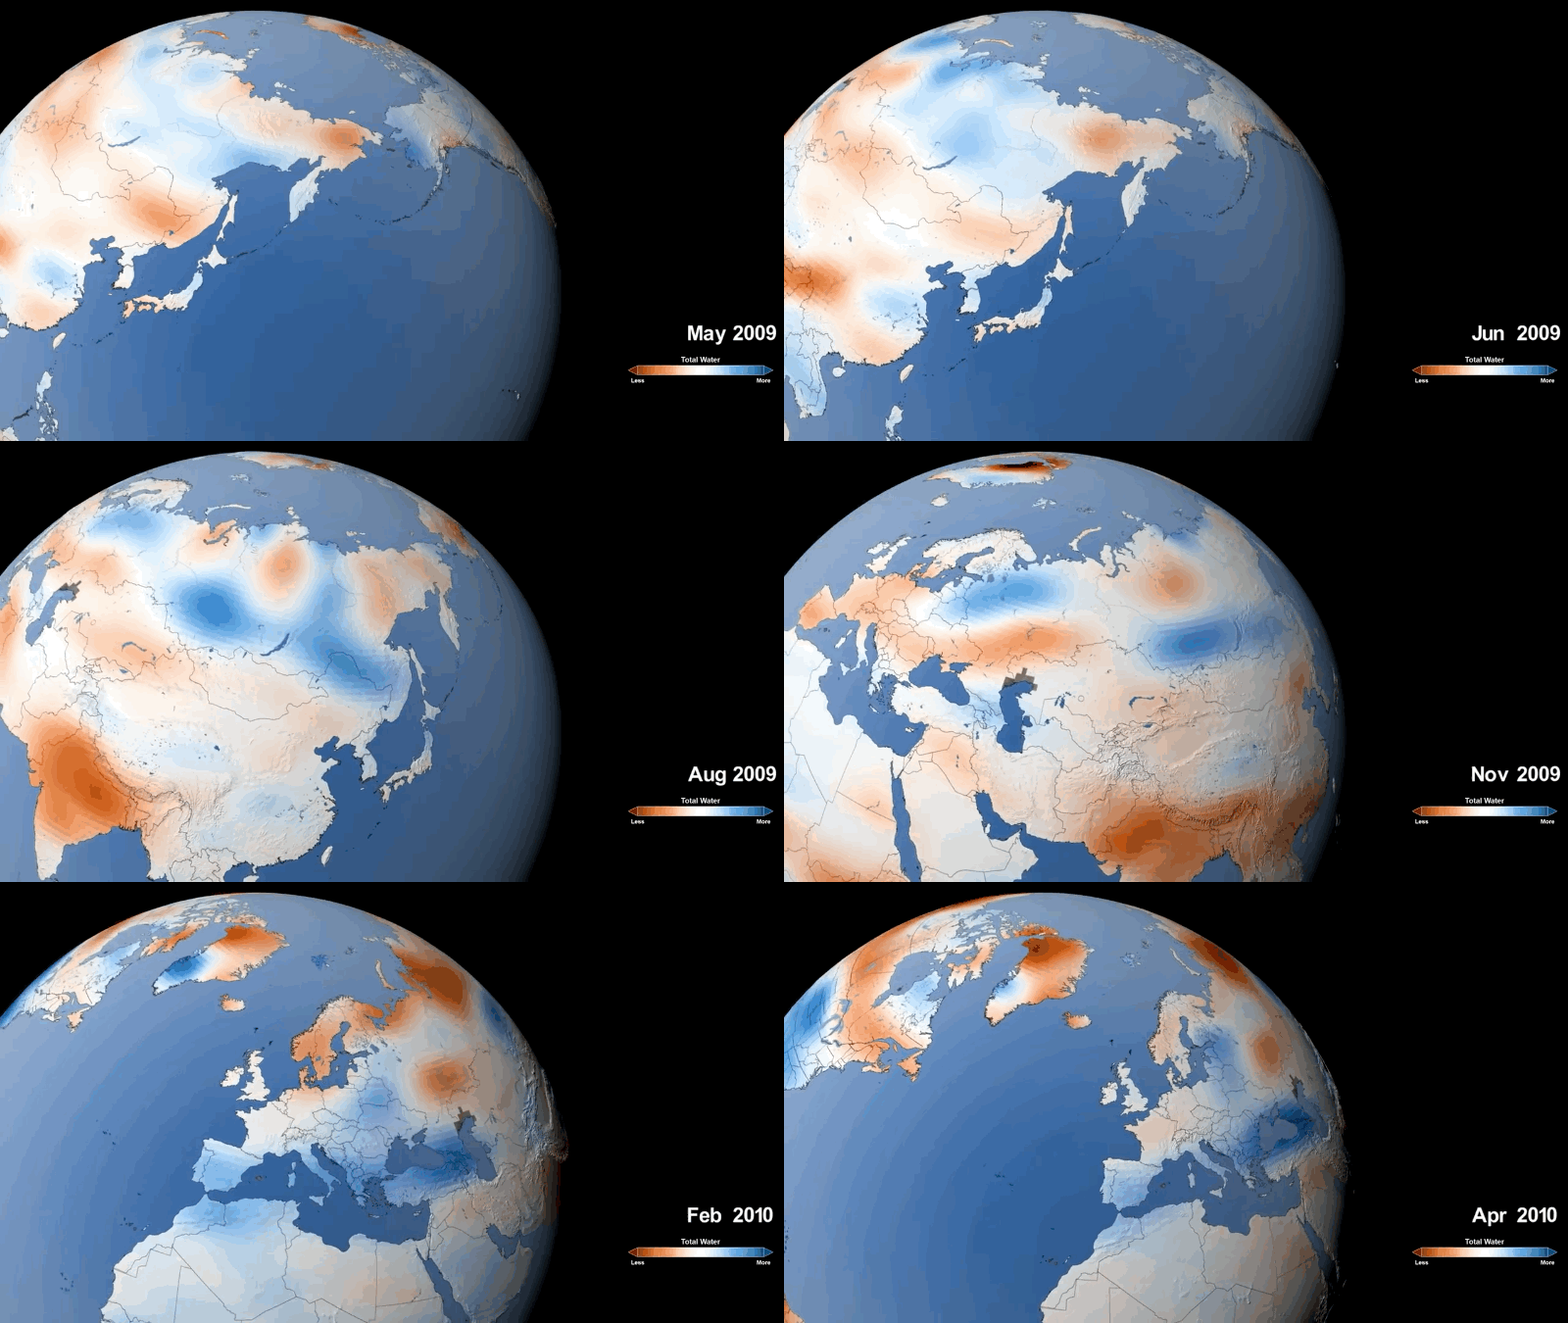
Teachable Moment: NASA Mission Gets the View on Earth’s Water Resources from Space
Explore the water cycle and its effects on communities through the lens of a NASA satellite designed to track the movement of water around the globe.
-
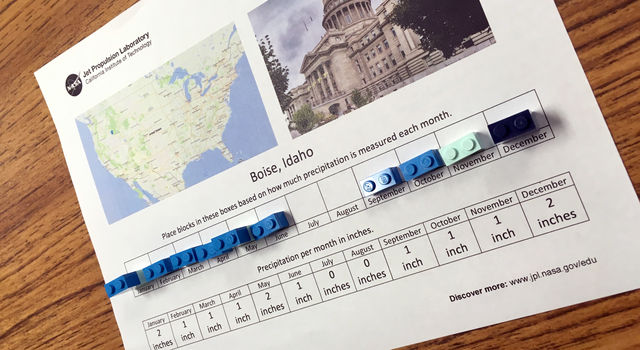
Precipitation Towers: Modeling Weather Data
This lesson uses stacking cubes as a way to graph precipitation data, comparing the precipitation averages and seasonal patterns for several locations.
Grades K-5
Time 30 mins - 1 hr
-
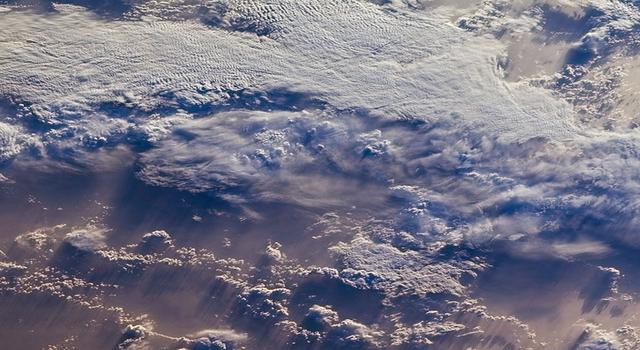
The Sky and Dichotomous Key
Students learn about cloud types to be able to predict inclement weather. They will then identify areas in the school affected by severe weather and develop a solution to ease the impacts of rain, wind, heat or sun.
Grades K-3
Time 30 mins - 1 hr
Wildfires and Temperature
-
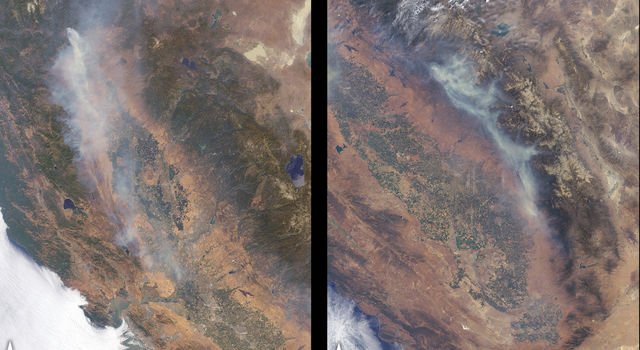
Teachable Moment: The Science of Wildfires
As wildfires burn over larger areas and longer portions of the year, NASA scientists are finding new ways to study their impacts on our climate and communities.
-
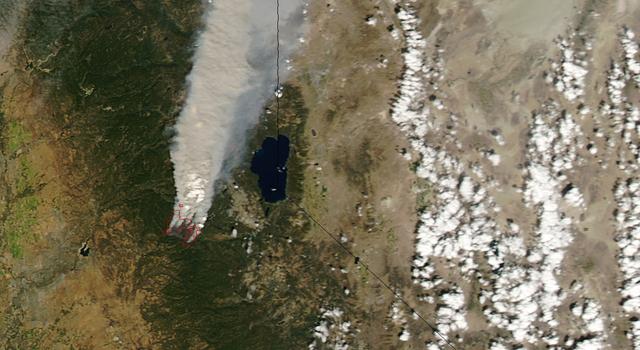
Fired Up Over Math: Studying Wildfires from Space
Students learn how scientists assess wildfires using remote sensing and solve related math problems, appropriate for various grade levels.
Grades 3-12
Time 30 mins - 1 hr
-
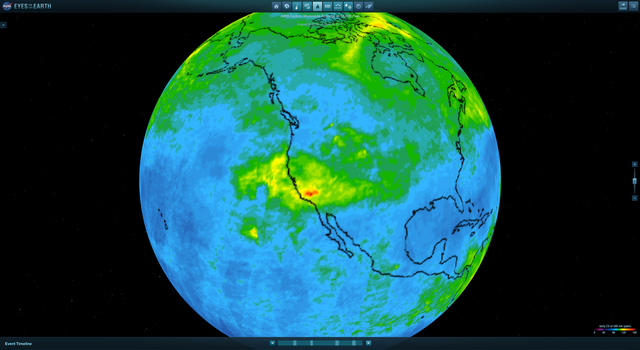
Pixels on Fire
Students use mobile devices and computers to learn about remote sensing and satellite data to determine when and where wildfires have started.
Grades 4-8
Time 30 mins - 1 hr
-
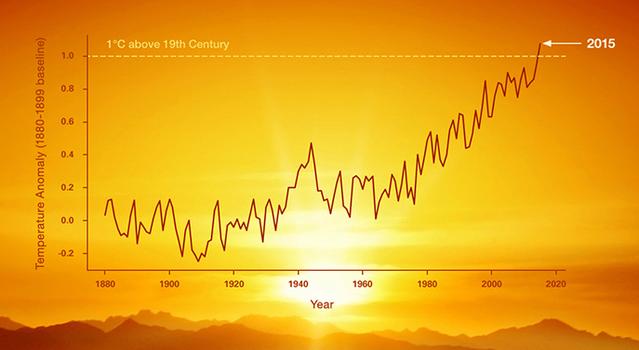
Graphing Global Temperature Trends
Students use global temperature data to create models and compare short-term trends to long-term trends.
Grades 5-12
Time 1-2 hrs
Sea Level
-
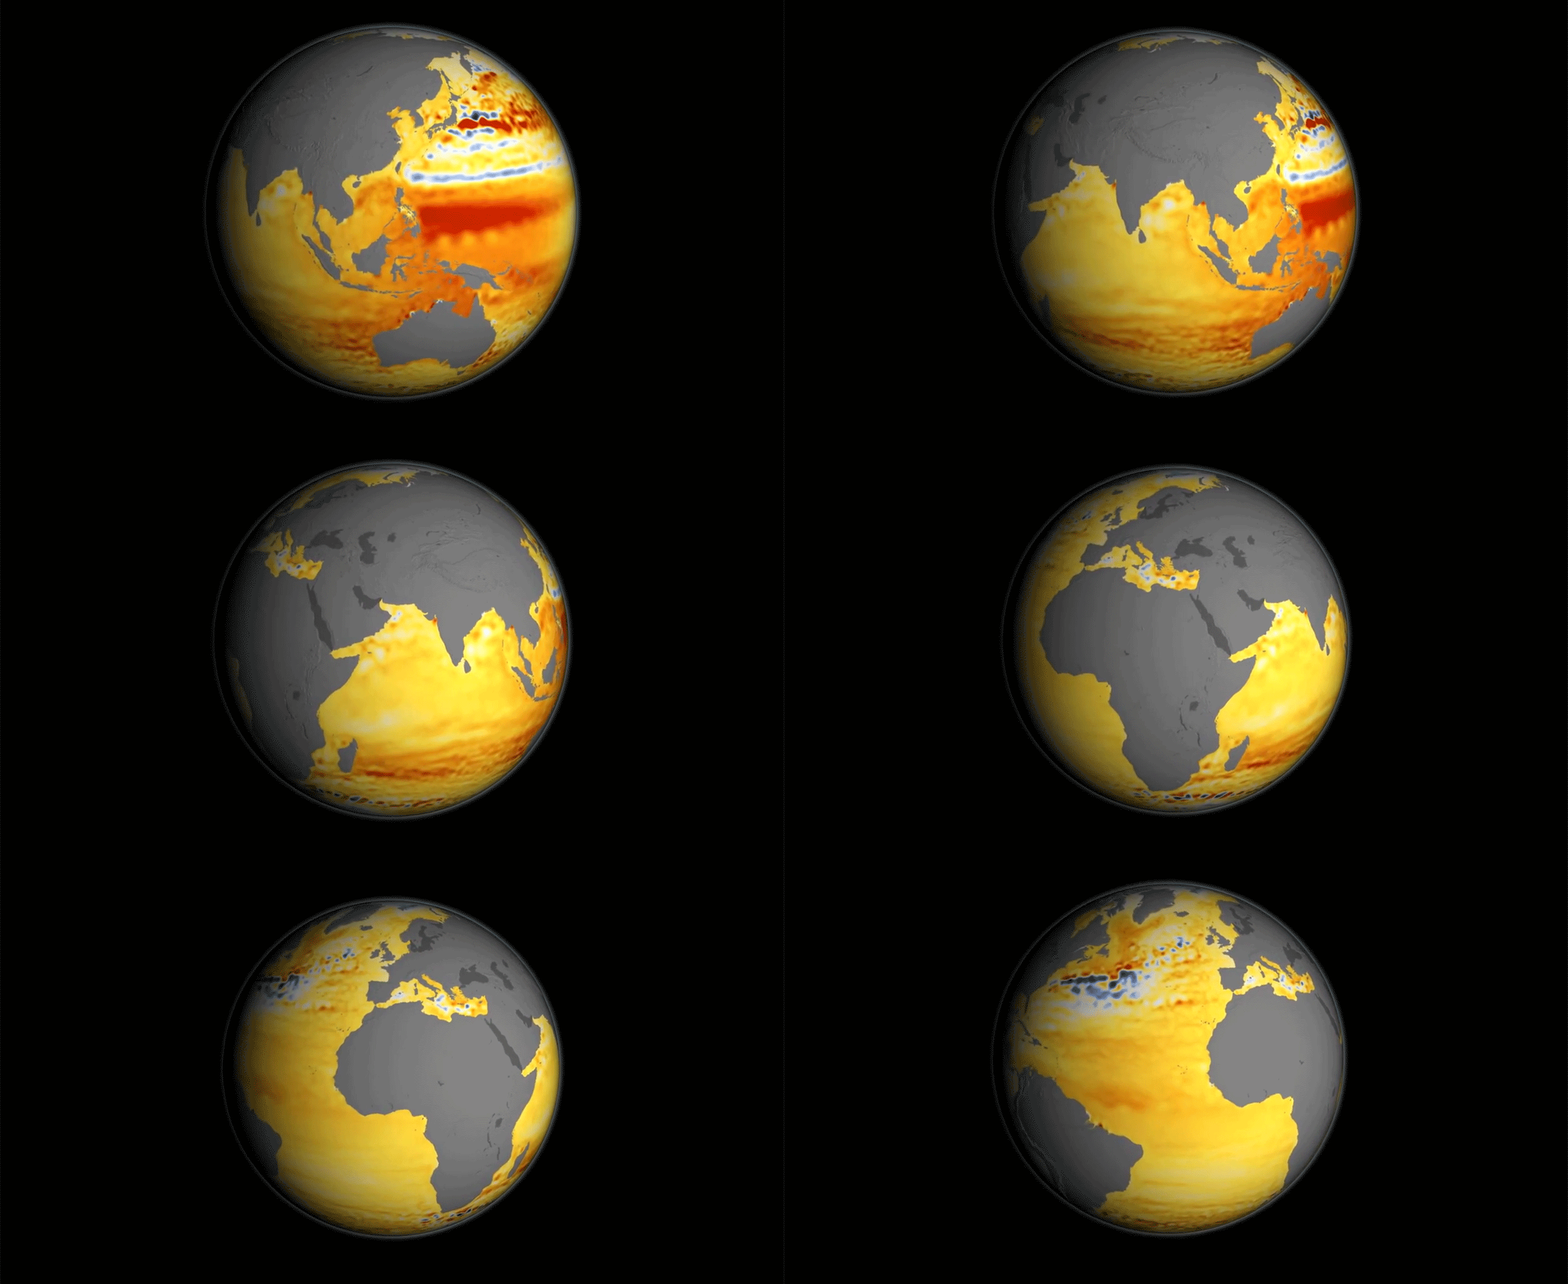
Teachable Moment: The Science of Earth's Rising Seas
How do we know sea-level rise is happening and what’s causing it? Learn about the NASA satellites studying the problem and get students exploring the data through math.
-
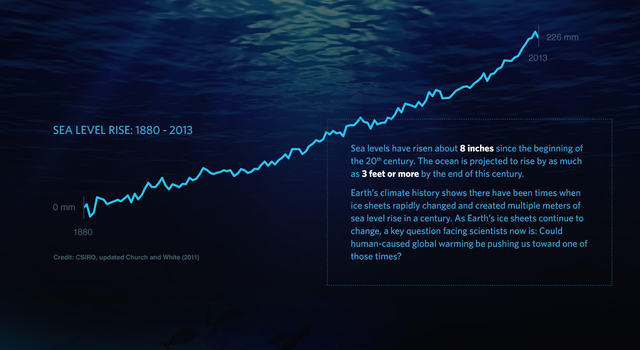
Graphing Sea-Level Trends
In this activity, students will use sea-level rise data to create models and compare short-term trends to long-term trends. They will then determine whether sea-level rise is occurring based on the data.
Grades 5-12
Time 1-2 hrs
Satellites and Data
-
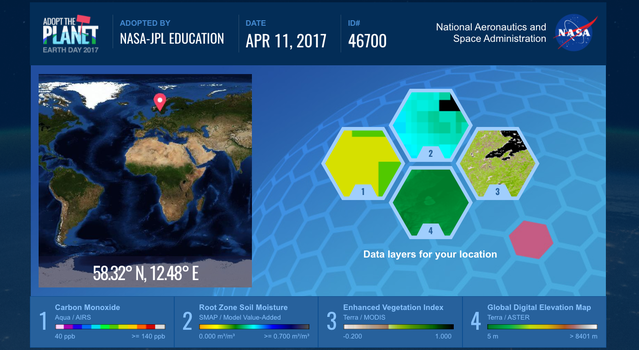
Teachable Moment: Celebrate Earth Day with NASA Science Data
NASA uses a fleet of satellites and science instruments to study our changing climate. Here’s how students can use that NASA data to do Earth science of their own.
-

How to Read a Heat Map
Students learn to read, interpret and compare “heat map” representations of Earth science data.
Grades 4-12
Time 30 mins - 1 hr
-
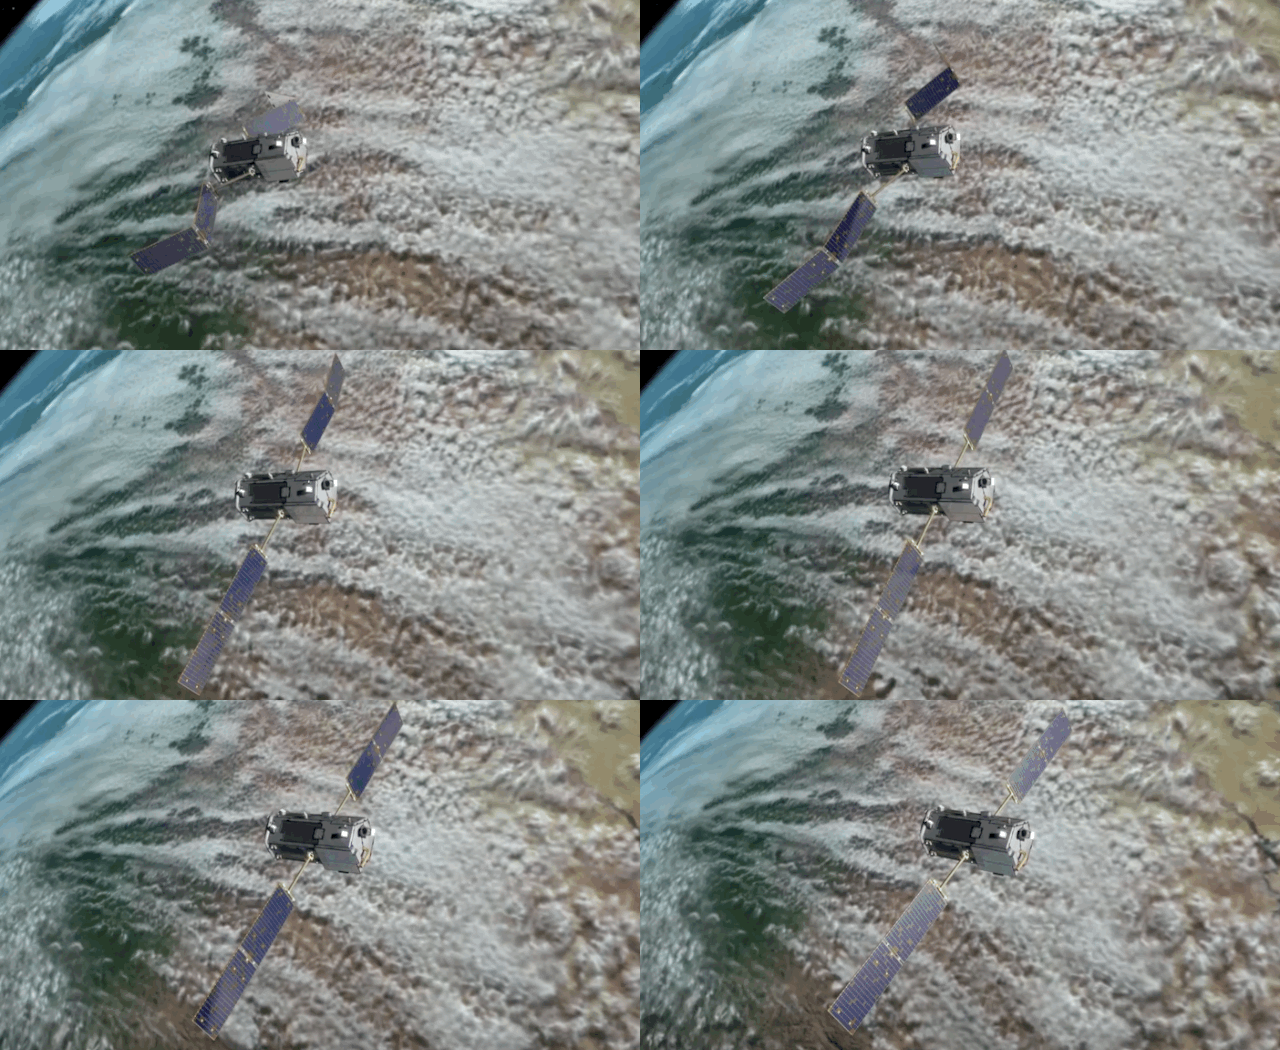
Build a Satellite
Students will use the engineering design process to design, build, test and improve a model satellite intended to investigate the surface of a planet.
Grades 5-8
Time > 2 hrs
Climate
For Students
-
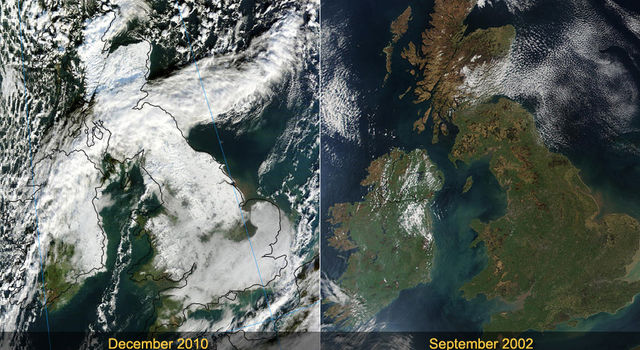
The Change of Seasons: Views from Space
See how seasonal changes affect our planet.
Type Slideshow
Subject Earth Science
-

Take the Pi in the Sky Challenge
Can you use pi to solve these stellar math problems faced by NASA scientists and engineers?
Type Slideshow
Subject Math
-

Make a Cloud in a Bottle
Have you ever wondered how clouds form? In this activity, you can make your own cloud to see for yourself!
Type Project
Subject Earth Science
-
NASA's Earth Minute
Learn how NASA studies Earth's weather and climate in these one minute videos!
Type Video Series
Subject Earth Science
Explore More
- Hurricanes as Heat Engines Story Map Lesson
- NOAA Educator Resources
- Article: "The Impact of Climate Change on Natural Disasters"
- NASA Earth Observatory - Atmosphere
- NASA Earth Observatory - Natural Event
- Interactive: NASA Eyes
Resources for Students
TAGS: Earth, Earth science, climate change, weather, extreme weather, hurricane, wildfire, typhoons, drought, flood, sea level rise, Climate TM


