Teachable Moments | December 8, 2022
NASA Mission Takes a Deep Dive Into Earth's Surface Water
Explore how and why the SWOT mission will take stock of Earth's water budget, what it could mean for assessing climate change, and how to bring it all to students.
Update: Dec. 15, 2022 – NASA, the French space agency, and SpaceX are now targeting 3:46 a.m. PST (6:46 a.m. EST) on Friday, Dec.16, for the launch of the Surface Water and Ocean Topography (SWOT) satellite. Visit NASA's SWOT launch blog for the latest updates.
NASA is launching an Earth-orbiting mission that will map the planet’s surface water resources better than ever before. Scheduled to launch on Dec. 16 from Vandenberg Space Force Base in California, the Surface Water and Ocean Topography, or SWOT mission is the latest international collaboration designed to monitor and report on our home planet. By providing us with a highly detailed 3D view of rivers, lakes, and oceans, SWOT promises to improve our understanding of Earth’s water cycle and the role oceans play in climate change, as well as help us better respond to drought and flooding.
Read on to find out why we're hoping to learn more about Earth's surface water, get to know the science behind SWOT's unique design, and follow along with STEM teaching and learning resources.
a name="swot_why">Why It's Important
Observing Earth from space provides scientists with a global view that is important for understanding the whole climate system. In the case of SWOT, we will be able to monitor Earth’s surface water with unprecedented detail and accuracy. SWOT will provide scientists with measurements of water volume change and movement that will inform our understanding of fresh water availability, flood hazards, and the mechanisms of climate change.
Scientists and engineers provide an overview of the SWOT mission. Credit: NASA/JPL-Caltech | Watch on YouTube
Water Flow
Scientists use a variety of methods to track Earth’s water. These include stream and lake gauges and even measurements from space such as sea surface altimetry and gravitational measurements of aquifer volumes. Monitoring of river flow and lake volume is important because it can tell us how much freshwater is readily available and at what locations. River flow monitoring can also help us make inferences about the downstream environmental impact. But monitoring Earth’s surface water in great detail with enough frequency to track water movement has proven challenging. Until now, most monitoring of river flow and lake levels has relied on water-flow and water-level gauges placed across Earth, which requires that they be accessible and maintained. Not all streams and lakes have gauges and previous space-based altimetry and gravitational measurements, though useful for large bodies of water, have not been able to adequately track the constant movement of water through smaller rivers or lakes.
Here's why understanding Earth’s "water budget" is an important part of understanding our planet and planning for future water needs.
SWOT will be able to capture these measurements across the globe in 3D every 21 days. The mission will monitor how much water is flowing through hundreds of thousands of rivers wider than 330 feet (100 meters) and keep a close watch on the levels of more than a million lakes larger than 15 acres (6 hectares). Data from the mission will be used to create detailed maps of rivers, lakes, and reservoirs that will enable accurate monitoring to provide a view of freshwater resources that is not reliant on physical access. Meanwhile, SWOT’s volumetric measurements of rivers, lakes, and reservoirs will help hydrologists better track drought and flooding impacts in near-real-time.
Coastal Sea Level Rise
SWOT will measure our oceans with unprecedented accuracy, revealing details of ocean features as small as 9 miles (15 kilometers) across. SWOT will also monitor sea levels and tides. Though we have excellent global sea level data, we do not have detailed sea level measurements near coastlines. Coastal sea levels vary across the globe as a result of ocean currents, weather patterns, land changes, and other factors. Sea levels are rising faster than ever, and higher sea levels also mean that hurricane storm surges will reach farther inland than ever before, causing substantially more damage than the same category of hurricanes in the past. SWOT will be able to monitor coastal sea level variations and fill gaps in the observations we currently have from other sources.
What is sea level rise and what does it mean for our planet? | › View Transcript
Ocean Heat Sinks
Further contributing to our understanding of the role Earth’s oceans play in climate change, SWOT will explore how the ocean absorbs atmospheric heat and carbon, moderating global temperatures and climate change. Scientists understand ocean circulation on a large scale and know that ocean currents are driven by temperature and salinity differences. However, scientists do not currently have a good understanding of fine-scale ocean currents, where most of the ocean's motion-related energy is stored and lost. Circulation at these fine scales is thought to be responsible for transporting half of the heat and carbon from the upper ocean to deeper layers. Such downward ocean currents have helped to mitigate the decades-long rise in global air temperatures by absorbing and storing heat and carbon away from the atmosphere. Knowing more about this process is critical for understanding the mechanisms of global climate change.
JPL scientist Josh Willis uses a water balloon to show how Earth's oceans are absorbing most of the heat being trapped on our warming world. | › Related lesson
These fine-scale ocean currents also transport nutrients to marine life and circulate pollutants such as crude oil and debris. Understanding nutrient transport helps oceanographers assess ocean health and the productivity of fisheries. And tracking pollutants aids in natural hazard assessment, prediction, and response.
How It Works
A joint effort between NASA and the French space agency – with contributions from the Canadian and UK space agencies – SWOT will continue NASA’s decades-long record of monitoring sea surface height across the globe. But this mission will add a level of detail never before achieved.
SWOT will measure more than 90% of Earth’s surface water, scanning the planet between 78°N latitude and 78°S latitude within 1 centimeter of accuracy and retracing the same path every 21 days. Achieving this level of accuracy from a spacecraft height of 554 miles (891 kilometers) requires that the boom using radar to measure water elevation remain stable within 2 microns – or about 3% of the thickness of a human hair.
This visualization shows ocean surface currents around the world during the period from June 2005 through December 2007. With its new, high resolution wide-swath measurements, SWOT will be able to observe eddies and current features at greater resolution than previously possible. Credit: NASA Scientific Visualization Studio | Watch on YouTube
Prior to SWOT, spacecraft have used conventional nadir, or straight-down, altimetry to measure sea surface height. Conventional nadir altimetry sends a series of radar or laser pulses down to the surface and measures the time it takes for each signal to return to the spacecraft, thus revealing distances to surface features. To acquire more detailed information on surface water, SWOT will use an innovative instrument called the Ka-band Radar Interferometer, or KaRIn, to measure water height with exceptional accuracy. Ka-band is a portion of the microwave part of the electromagnetic spectrum. SWOT uses microwaves because they can penetrate clouds to return data about water surfaces.

SWOT will track Earth's surface water in incredible detail using an innovative instrument called the Ka-band Radar Interferometer, or KaRIn. Image credit: NASA/JPL-Caltech | + Expand image
The KaRIn instrument uses the principles of synthetic aperture radar combined with interferometry to measure sea surface height. A radar signal is emitted from the end of the 10-meter-wide boom on the spacecraft. The reflected signal is then received by antennas on both ends of the boom, capturing data from two 30-mile (50-kilometer) wide swaths on either side of the spacecraft. The received signals will be slightly out of sync, or phase, from one another because they will travel different distances to return to the receivers on either end of the boom. Knowing the phase difference, the distance between the antennas, and the radar wavelength allows us to calculate the distance to the surface.

Radar signals bounced off the water’s surface will be received by antennas on both ends of SWOT's 10-meter-wide boom. The received signals will be slightly out of phase because they will travel different distances as they return to the receivers. Scientists use this phase difference and the radar wavelength to calculate the distance to the surface. Image credit: NASA/JPL-Caltech | + Expand image
The observations acquired by the two antennas can be combined into what is known as an interferogram. An interferogram is a pattern of wave interference that can reveal more detail beyond the 1-centimeter resolution captured by the radar. To explain how it works, we'll recall a couple of concepts from high school physics. When out-of-phase waves from the two antennas are combined, constructive and destructive interference patterns result in some wave crests being higher and some wave troughs being lower than those of the original waves. The patterns that result from the combination of the waves reveal more detail with resolution better than the 1-centimeter wavelength of the original Ka-band radar waves because the interference occurs over a portion of a wavelength. An interferogram can be coupled with elevation data to reveal a 3D representation of the water’s surface.

The KaRIn instrument illuminates two parallel tracks of approximately 50 kilometres on either side of a nadir track from a traditional altimeter. The signals are received by two antennas 10 metres apart and are then processed to yield interferometry measurements. Image credit: NASA/JPL-Caltech | + Expand image
This highly accurate 3D view of Earth’s surface water is what makes SWOT so unique and will enable scientists to more closely monitor the dynamics of the water cycle. In addition to observing ocean currents and eddies that will inform our understanding of the ocean’s role in climate change, SWOT's use of interferometry will allow scientists to track volumetric changes in lakes and quantify river flooding, tasks that cannot yet be done on a wide scale in any other way.

This interferogram was captured by the air-based UAVSAR instrument of the magnitude 7.2 Baja California earthquake of April 4, 2010. The interferogram is overlaid atop a Google Earth image of the region. Image credit: NASA/JPL/USGS/Google | › Learn more
Follow Along
SWOT is scheduled to launch no earlier than Dec. 16, 2022, on a SpaceX Falcon 9 rocket from Vandenberg Space Force Base in California. Tune in to watch the launch on NASA TV.
After launch, the spacecraft will spend 6-months in a calibration and validation phase, during which it will make a full orbit of Earth every day at an altitude of 553 miles (857 kilometers). Upon completion of this phase, SWOT will increase its altitude to 554 miles (891 kilometers) and assume a 21-day repeat orbit for the remainder of its mission.
Visit the mission website to follow along as data are returned and explore the latest news, images, and updates as SWOT provides a new view on one of our planet's most important resources.
Teach It
The SWOT mission is the perfect opportunity to engage students in studying Earth’s water budget and water cycle. Explore these lessons and resources to get students excited about the STEM involved in studying Earth’s water and climate change from space.
Educator Resources
-
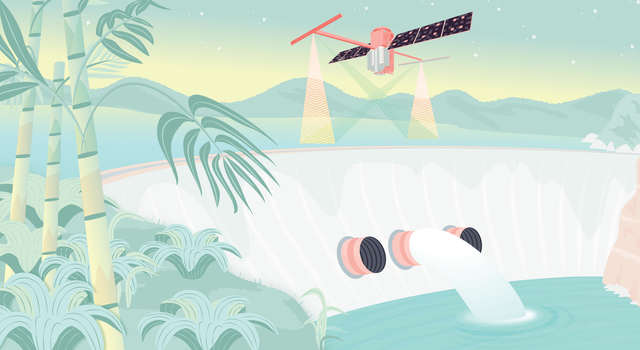 Collection
SWOT Mission Lessons for Educators
Explore the science and engineering behind the SWOT mission with this collection of standards-aligned lessons all about water.
-
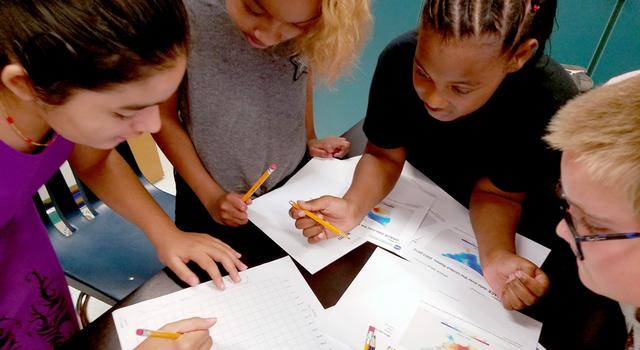 Collection
Climate Change Lessons for Educators
Explore a collection of standards-aligned STEM lessons for students that get them investigating climate change along with NASA.
-
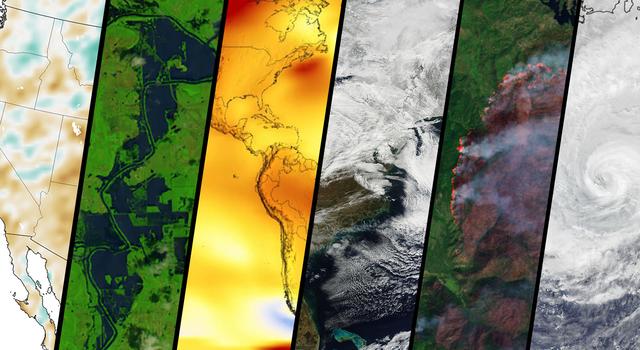 Collection
Teachable Moments in Climate Change
Explore this collection of Teachable Moments articles to get a primer on the latest NASA Earth science missions, plus find related education resources you can deploy right away!
-
 Expert Talk
Teaching Space With NASA – Monitoring Earth from Space
In this educational talk, NASA experts discuss how we build spacecraft to study climate, then answer audience questions.
Student Activities
-
 Collection
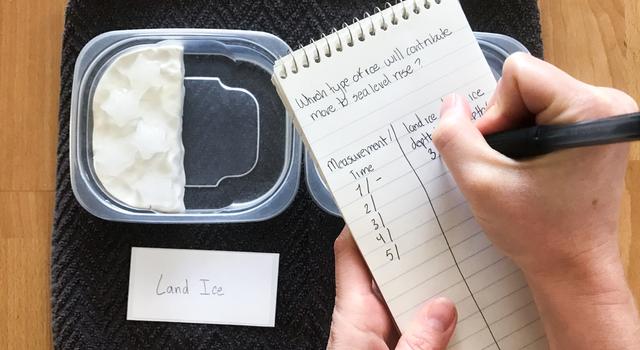
SWOT Mission Activities for Students
Explore projects, videos, slideshows, and games for students all about the water cycle and sea level rise.
-
 Collection
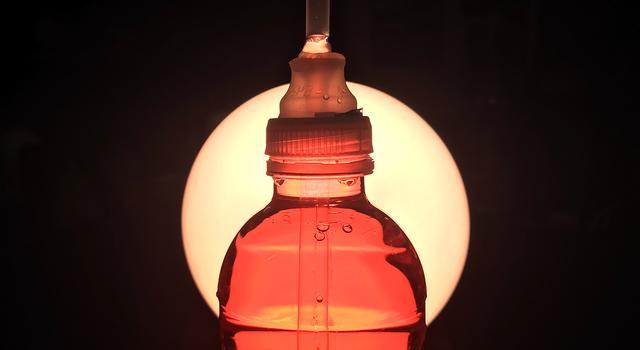
Climate Change Activities for Students
Learn about climate change and its impacts with these projects, videos, and slideshows for students.
-
 Collection
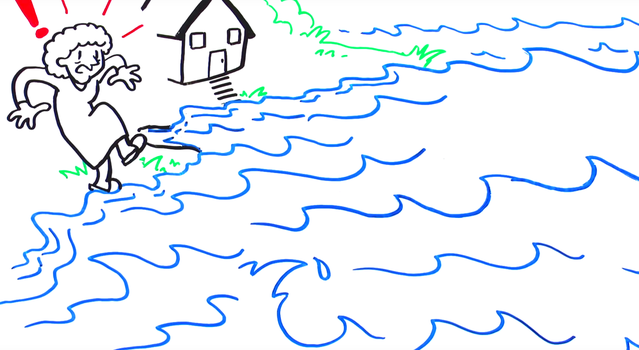
Earth Minute Video Series
This series of animated white-board videos for students of all ages explains key concepts about Earth science, missions, and climate change.
Explore More
Activities for Kids
- Download: SWOT Launch Bingo
- Video: How Much Water is on Earth?
- Game: Go With the Flow – An Ocean Currents Game
Websites
- SWOT Mission Website
- NASA Climate Change
- NASA Earth Observatory
- NASA Climate Kids
- NASA Sea Level Change
- NASA Cambio Climático en Español
Facts & Figures
Videos
Interactives
Image Gallery
Articles
- Climate articles from NASA
- Ask NASA Climate
- NASA People - Earth
- Water Mission to Gauge Alaskan Rivers on Front Lines of Climate Change
Podcast
TAGS: K-12 Education, Teachers, Educators, Earth Science, Earth, Climate Change, Climate, Satellites, Teachable Moments, Climate TM
Edu News | August 24, 2022
A Lesson for Every Day of the School Year
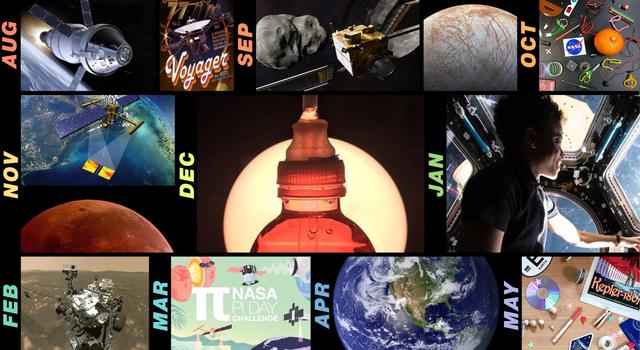
With 180 lessons in our online catalog, you can explore Earth and space with us all year long. We show you how with this handy NASA-JPL school year calendar.
We just added the 180th lesson to our online catalog of standards-aligned STEM lessons, which means JPL Education now has a lesson for every day of the school year. To celebrate and help you make the year ahead stellar, we've put together this monthly calendar of upcoming NASA events along with links to our related lessons, Teachable Moments articles, and student projects you can use to engage students in STEM while they explore Earth and space with us all year long.
August
The Voyagers Turn 45
The twin Voyager spacecraft launched in 1977 on a journey to explore the outer planets and beyond – and they're still going. Now more than 12 billion miles (19 billion kilometers) from Earth in a region known as interstellar space, they're the most distant human-made objects in space.
Get a primer on these fascinating spacecraft from Teachable Moments, then use it as a jumping off point for lessons on the scale, size, and structure of our solar system and how we communicate with distant spacecraft.
Lessons & Resources:
-
 Collection
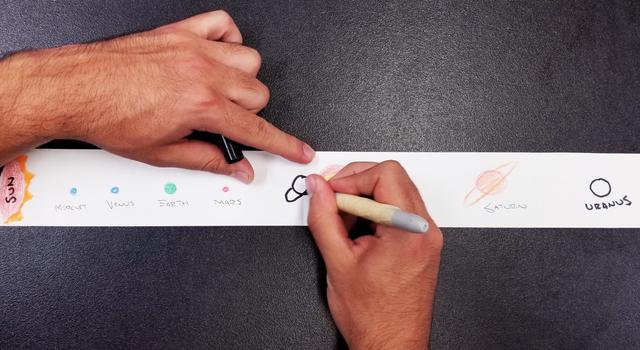
Voyager Lessons for Educators
Explore the science behind NASA's Voyager spacecraft with this collection of standards-aligned STEM lessons.
-
 Collection
Voyager Activities for Students
These DIY projects, slideshows, and videos will get students exploring the science behind NASA's Voyager spacecraft.
-
 Teachable Moments
The Farthest Operating Spacecraft, Voyagers 1 and 2, Still Exploring
The twin spacecraft launched in 1977 on an epic journey through the solar system and beyond offer lessons in what it takes to travel farther than ever before.
-
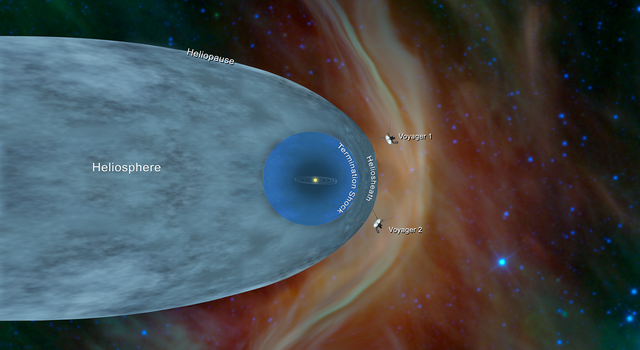 Teachable Moments
Then There Were Two: Voyager 2 Reaches Interstellar Space
Find out how the twin Voyager spacecraft took advantage of a rare planetary alignment to embark on a journey no spacecraft had before – or has since.
September
Rendezvous with an Asteroid
A distant asteroid system 6.8 million miles (11 million kilometers) from Earth was the site of NASA's first attempt at redirecting an asteroid. On September 26, the Double Asteroid Redirection Test, or DART, mission impacted the asteroid Dimorphos in an attempt to alter its speed and path around a larger asteroid known as Didymos. Dimorphos and Didymos do not pose a threat to Earth, which makes them a good proving ground for testing whether a similar technique could be used to defend Earth against potential impacts by hazardous asteroids in the future.
Get a primer on the DART mission and find related resources for the classroom in this article from our Teachable Moments series. Plus, explore our collection of standards-aligned lessons and activities all about asteroids to get students learning about different kinds of space rocks, geology, and meteoroid math.
Lessons & Resources:
-
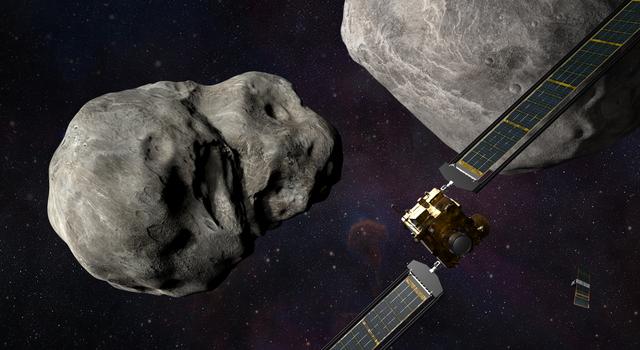 Teachable Moments
The Science Behind NASA's First Attempt at Redirecting an Asteroid
Find out more about the historic first test, which could be used to defend our planet if a hazardous asteroid were discovered. Plus, explore lessons to bring the science and engineering of the mission into the classroom.
-
 Collection
Asteroids Lessons for Educators
Explore a collection of standards-aligned lessons all about asteroids and craters.
-
 Collection
Asteroids Actvities for Students
Explore projects, videos, slideshows, and games for students all about asteroids.
A Closer Look at Europa
Just a few days later, on September 29, the Juno spacecraft that had been orbiting Jupiter since 2016 captured the closest views of Jupiter’s moon Europa in more than 20 years. The ice-covered moon is thought to contain a subsurface liquid-water ocean, making it an exciting new frontier in our search for life beyond Earth. NASA's Europa Clipper mission, which is scheduled to launch in 2024 is designed to study the moon in more detail. But until Europa Clipper arrives at the Jovian system in 2030, these observations from Juno are our best chance to get a closer look at this fascinating moon.
Learn more about Europa and why it is interesting to scientists in this talk from our Teaching Space With NASA series featuring a Europa Clipper mission scientist. Then, explore our Ocean Worlds Lesson Collection for ideas on making classroom connections.
Lessons & Resources:
-
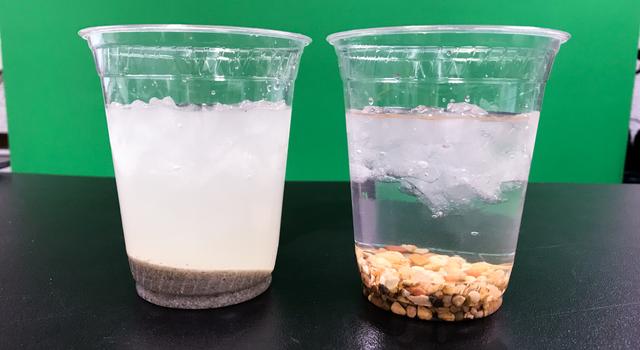 Collection
Ocean Worlds Lessons for Educators
Explore a collection of standards-aligned STEM lessons all about ocean worlds throughout our solar system.
-
 Collection
Ocean Worlds Actvities for Students
Learn about the ocean worlds throughout our solar system with these science and engineering activities for students.
-
 Expert Talk
Teaching Space With NASA – Robotic Oceanographers
Hear from scientists exploring Earth's oceans and learn about how we use robotic explorers to collect data on how our oceans are changing as well as explore ocean worlds beyond Earth.
October
Celebrate Halloween Like a Space Explorer
The month of October is the perfect time to get students exploring our STEM activities with a Halloween twist. Students can learn how to carve a pumpkin like a JPL engineer, take a tour of mysterious locations throughout the solar system, and dig into the geology inside their Halloween candy.
October 31 is also JPL's 86th birthday, which makes October a great time to learn more about JPL history, including the team of female mathematicians known as "human computers" who performed some of the earliest spacecraft-tracking calculations and the Laboratory's role in launching the first U.S. space satellite.
Lessons & Resources:
-
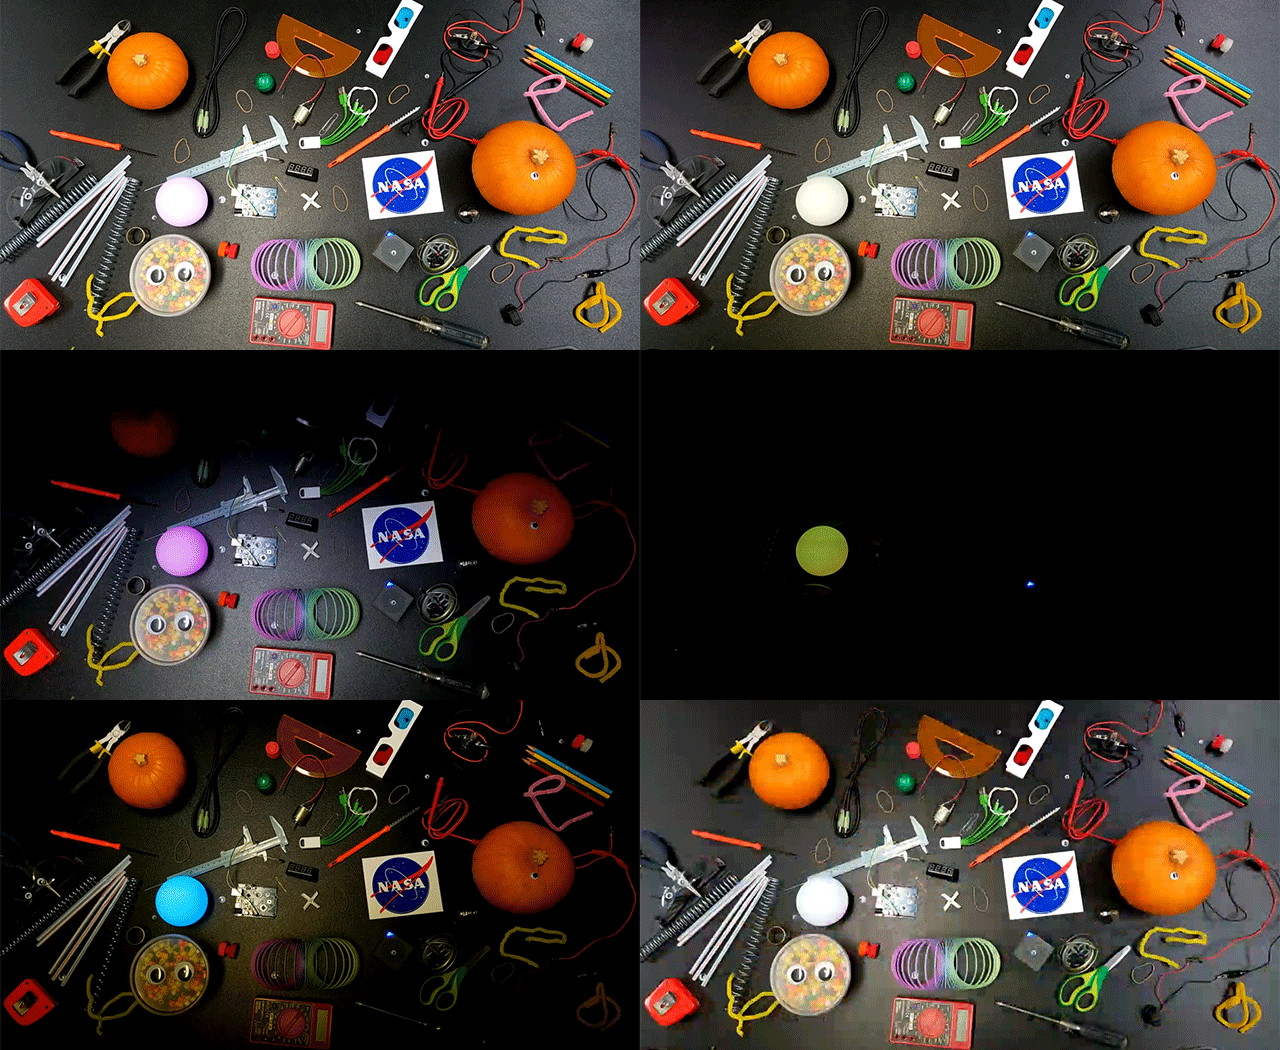 Collection
Halloween Actvities for Students
Explore student projects and slideshows that put a Halloween twist on STEM.
-
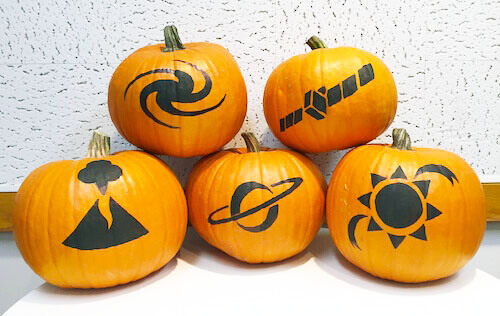 Project for Kids
Pumpkin Stencils
Celebrate the fall season and Halloween by making your very own space-themed pumpkins with these easy-to-use stencils from NASA's Space Place!
-
 Teachable Moments
When Computers Were Human
Learn about the important but little-known role women played in the early days of space exploration, then try a math lesson inspired by their work.
-
 Teachable Moments
Explorer 1 Anniversary Marks 60 Years of Science in Space
The fascinating history of America’s first space satellite serves as a launching point for lessons in engineering design, motion and flight, and Earth science.
November
Watch a Total Lunar Eclipse
Look up in the early morning hours of November 8 to watch one of the most stunning spectacles visible from Earth: a total lunar eclipse. This one will be viewable in North and South America, as well as Asia and Australia.
Learn more about lunar eclipses and how to watch them from our Teachable Moments series. Then, get students of all ages outside and observing the Moon with lessons on moon phases and the hows and whys of eclipses. Students can even build a Moon calendar so they always know when and where to look for the next eclipse.
Lessons & Resources:
-
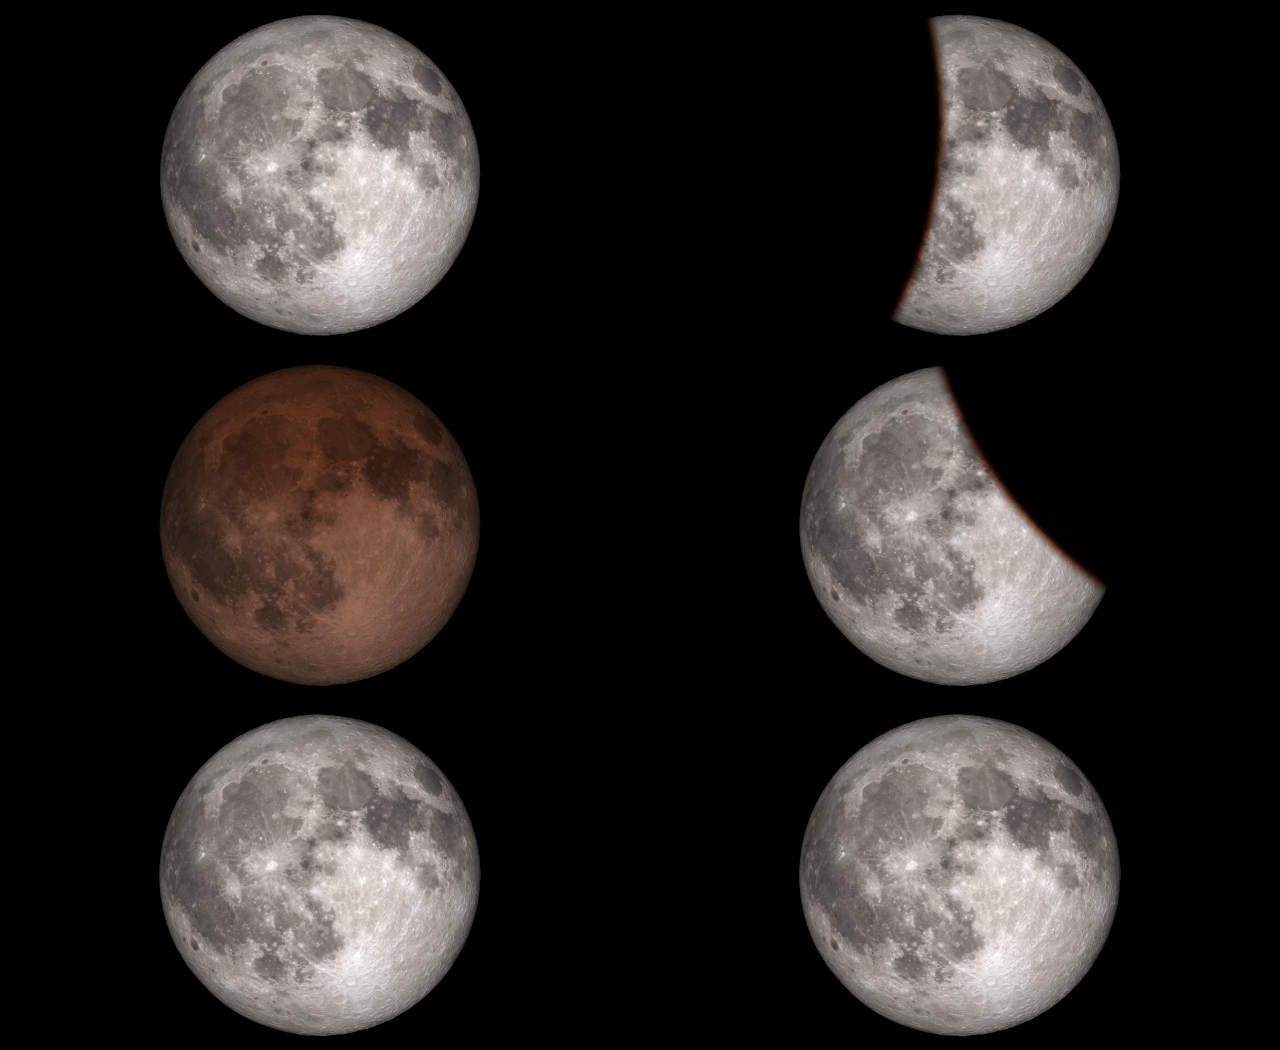 Teachable Moments
How to Watch a Total Lunar Eclipse and Get Students Observing the Moon
There’s no better time to learn about the Moon than during a lunar eclipse. Here’s how eclipses work, what to expect, and how to get students engaged.
-
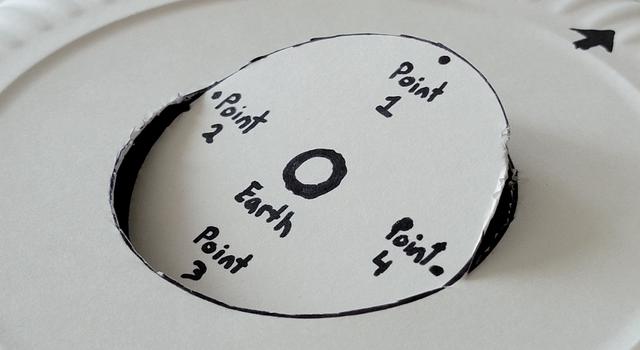 Collection
Moon Lessons for Educators
Teach students about the Moon with this collection of standards-aligned activities inspired by real NASA missions and science.
-
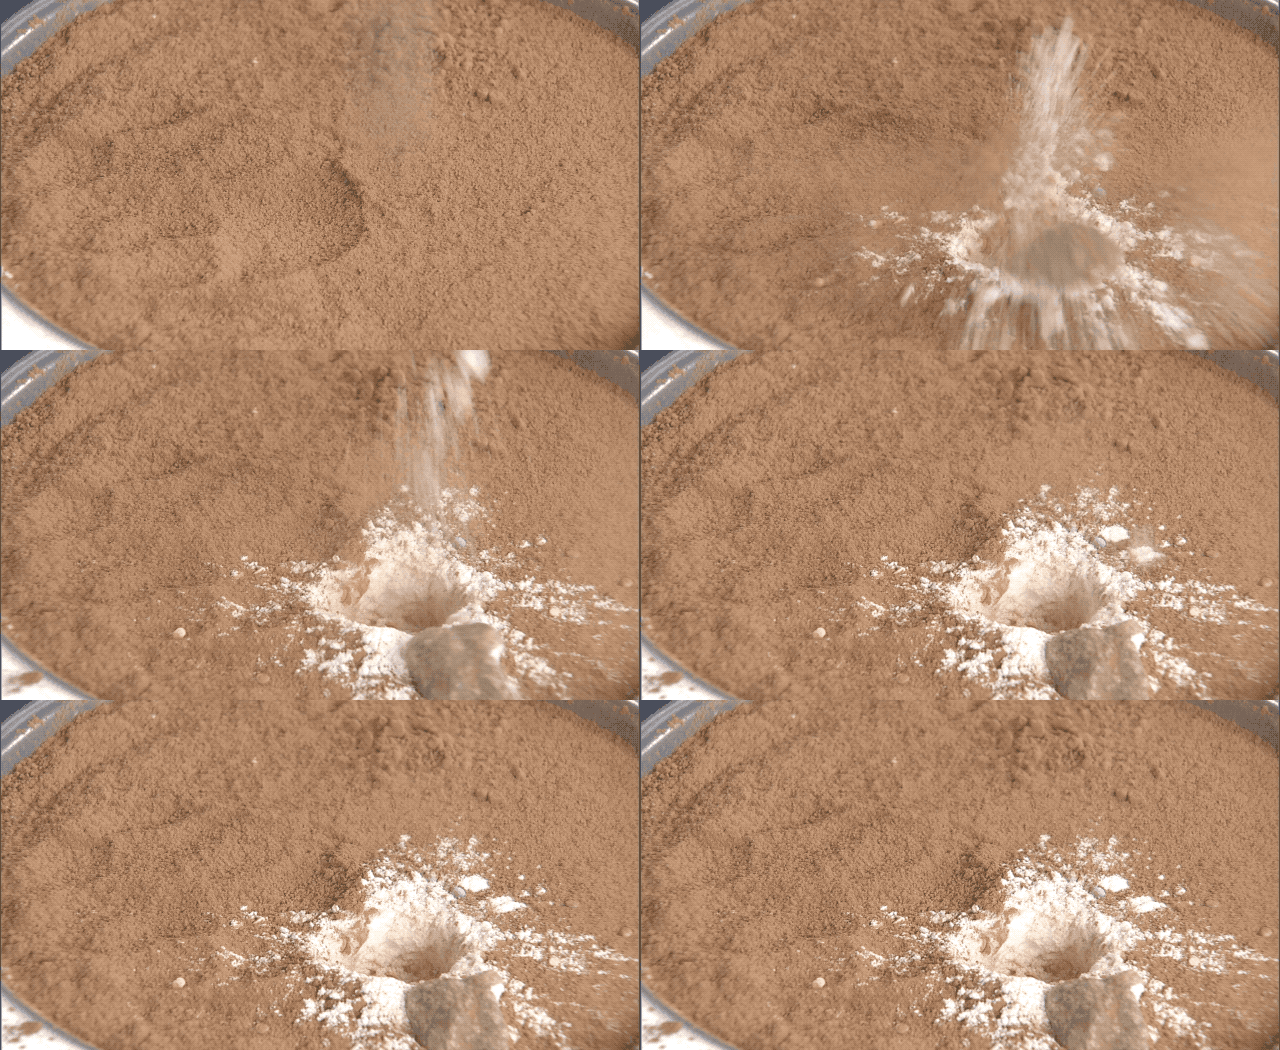 Collection
Moon Activities for Students
Learn all about the Moon with these projects, slideshows, and videos for students.
Artemis Takes a Giant Leap
NASA is making plans to send astronauts back to the Moon for the first time since 1972 – this time to establish a sustainable presence and prepare for future human missions to Mars. The first major step is Artemis I, which is testing three key components required to send astronauts beyond the Moon: the Orion spacecraft, the Space Launch System, or SLS, rocket and the ground systems at Kennedy Space Center in Florida. The uncrewed Artemis I mission marks the first test of all three components at once.
Get your K-12 students following along with lessons in rocketry and what it takes to live in space. Plus, register to follow along with the mission with resources and updates from NASA's Office of STEM Engagement.
Lessons & Resources:
-
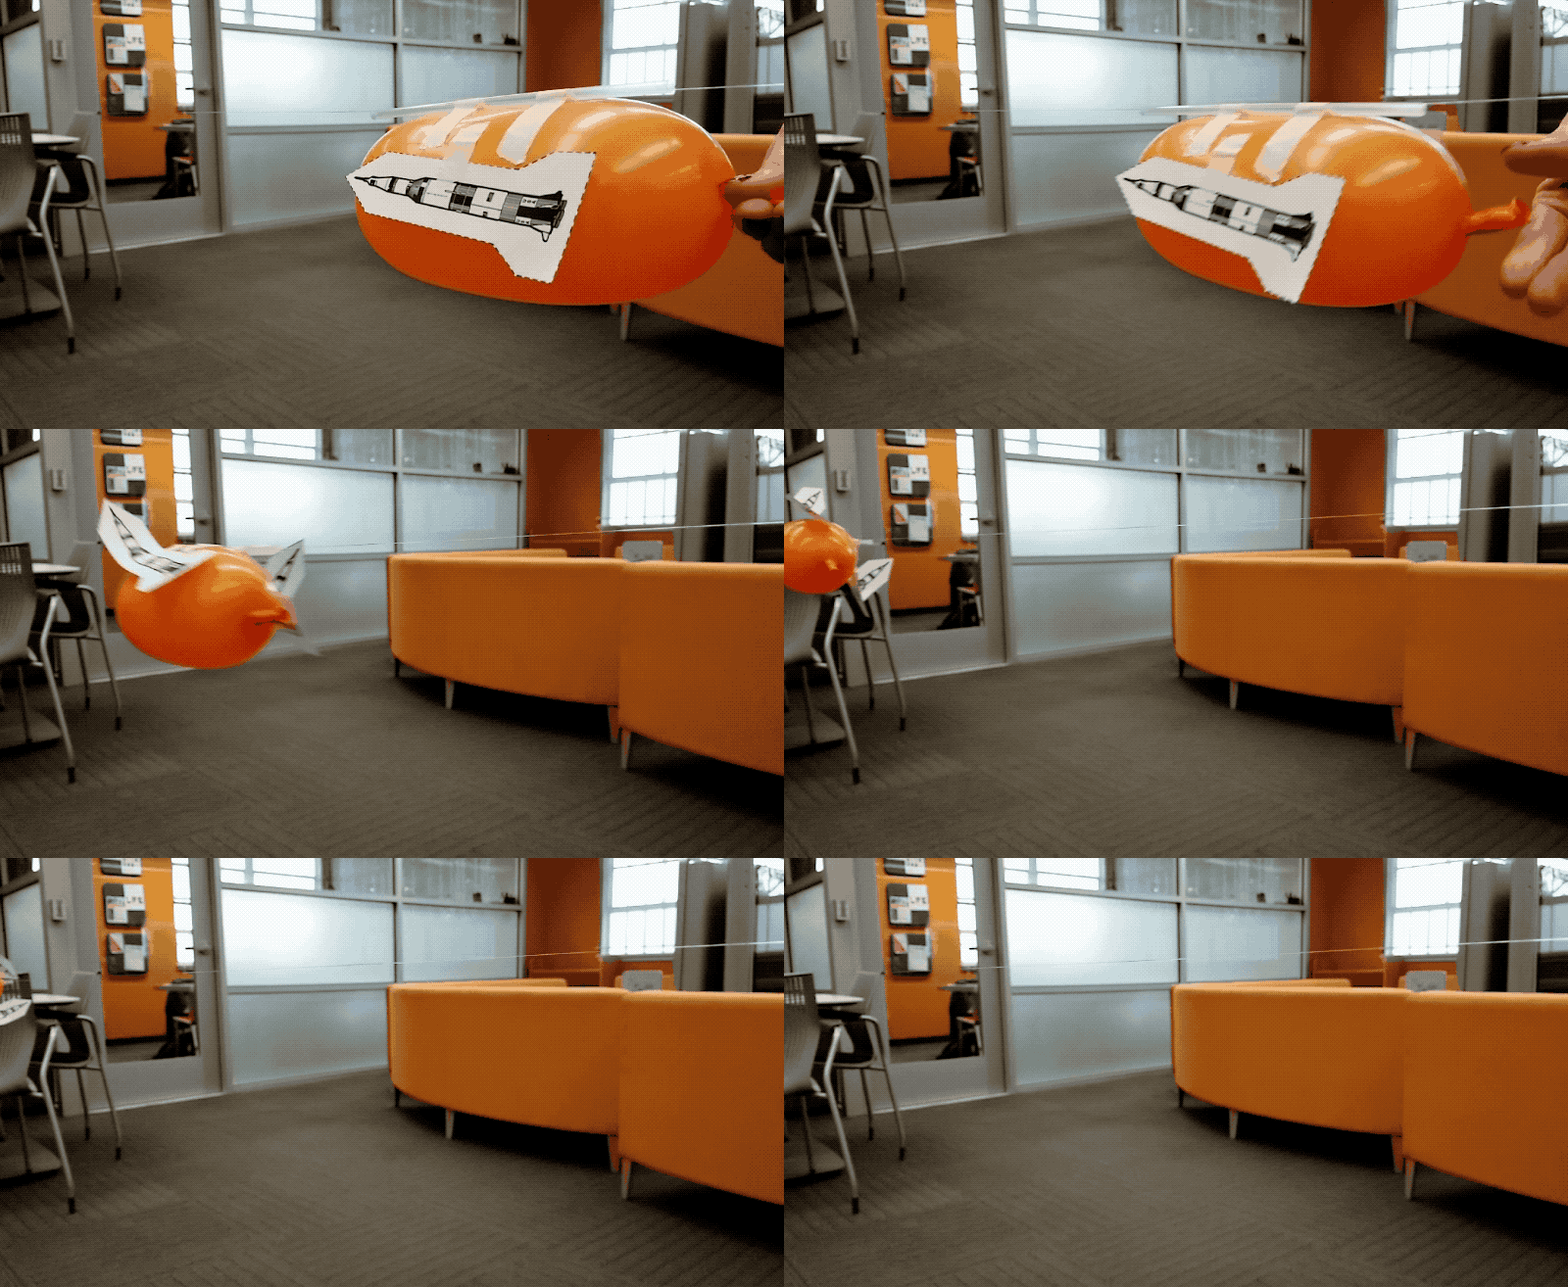 Collection
Artemis Lessons for Educators
Get students engaged in NASA's Artemis Program with STEM lessons all about the Moon, rockets, space habitats, and more
-
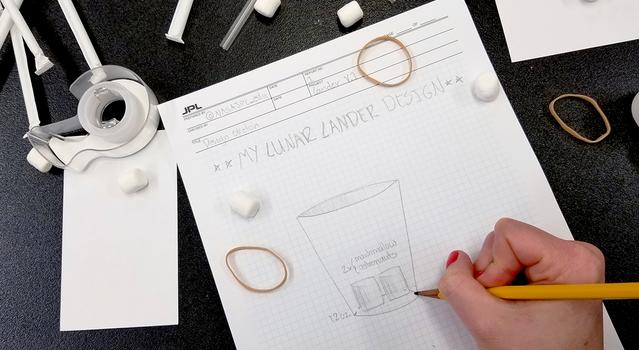 Collection
Artemis Activities for Students
These STEM projects and activities for students will get them exploring the Moon, rockets, space flight and other facets of NASA's Artemis Program.
-
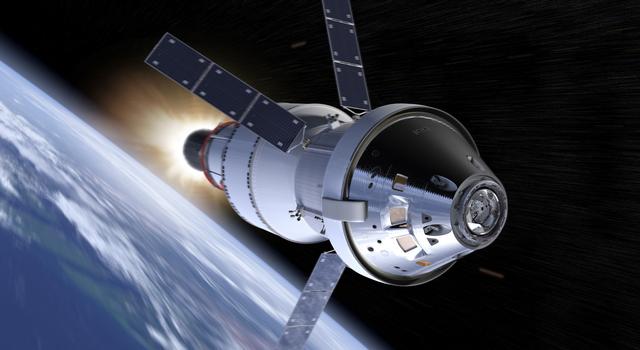 Public Event
Join NASA Online for Artemis I
Register to receive updates and resources related to Artemis I – the first in a series of Artemis Program missions designed to establish a sustainable human presence on the Moon and prepare for future human missions to Mars.
-
 Educator Resources
Artemis Toolkit
Explore Artemis resources for educators and students from NASA's Office of STEM Engagement.
-
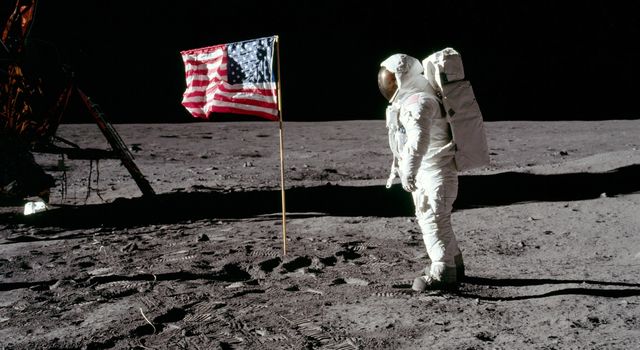 Teachable Moments
Celebrate the 50th Anniversary of NASA's Apollo Moon Landing
Explore the incredible history of the Apollo missions and find out what's in store for NASA's next mission to the Moon.
December
Satellite Launches on a Mission to Follow the Water
As crucial as water is to human life, did you know that no one has ever completed a global survey of Earth’s surface water? That is about to change with the launch of the SWOT mission. SWOT, which stands for Surface Water Ocean Topography, will use a state-of-the-art radar to measure the elevation of water in major lakes, rivers, wetlands, and reservoirs. It will also provide an unprecedented level of detail on the ocean surface. This data will help scientists track how these bodies of water are changing over time and improve weather and climate models.
Engage your students in learning about Earth’s water budget and how we monitor Earth from space with these lessons. And be sure to check out our Teachable Moments article for more about the SWOT mission and the science of our changing climate.
-
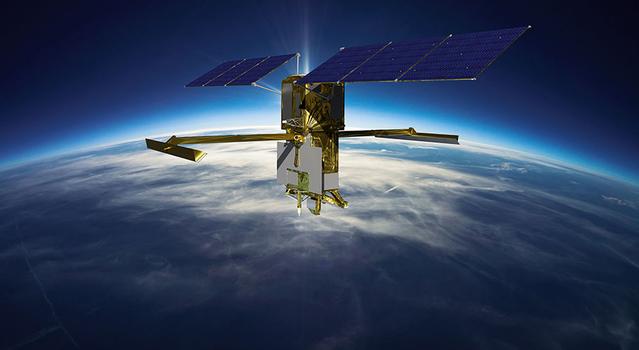 Teachable Moments
NASA Mission Takes a Deep Dive Into Earth's Surface Water
Explore how and why the SWOT mission will take stock of Earth's water budget, what it could mean for assessing climate change, and how to bring it all to students.
-
 Collection
SWOT Lessons for Educators
Explore the science and engineering behind the SWOT mission with this collection of standards-aligned lessons all about water.
-
 Collection
SWOT Actvities for Students
Explore projects, videos, slideshows, and games for students all about the water cycle and sea level rise.
Prepare for the Science Fair
Before you know it, it'll be science fair time. Avoid the stress of science fair prep by getting students organized and thinking about their projects before the winter recess. Start by watching our video series How to Do a Science Fair Project. A scientist and an engineer from JPL walk your students through all the steps they will need to create an original science fair project by observing the world around them and asking questions. You can also explore our science fair starter pack of lessons and projects to get students generating ideas and thinking like scientists and engineers.
Lessons & Resources:
-
 Video Series
How to Do a Science Fair Project
Learn all the ins and outs of crafting your very own science fair project.
-
 Collection
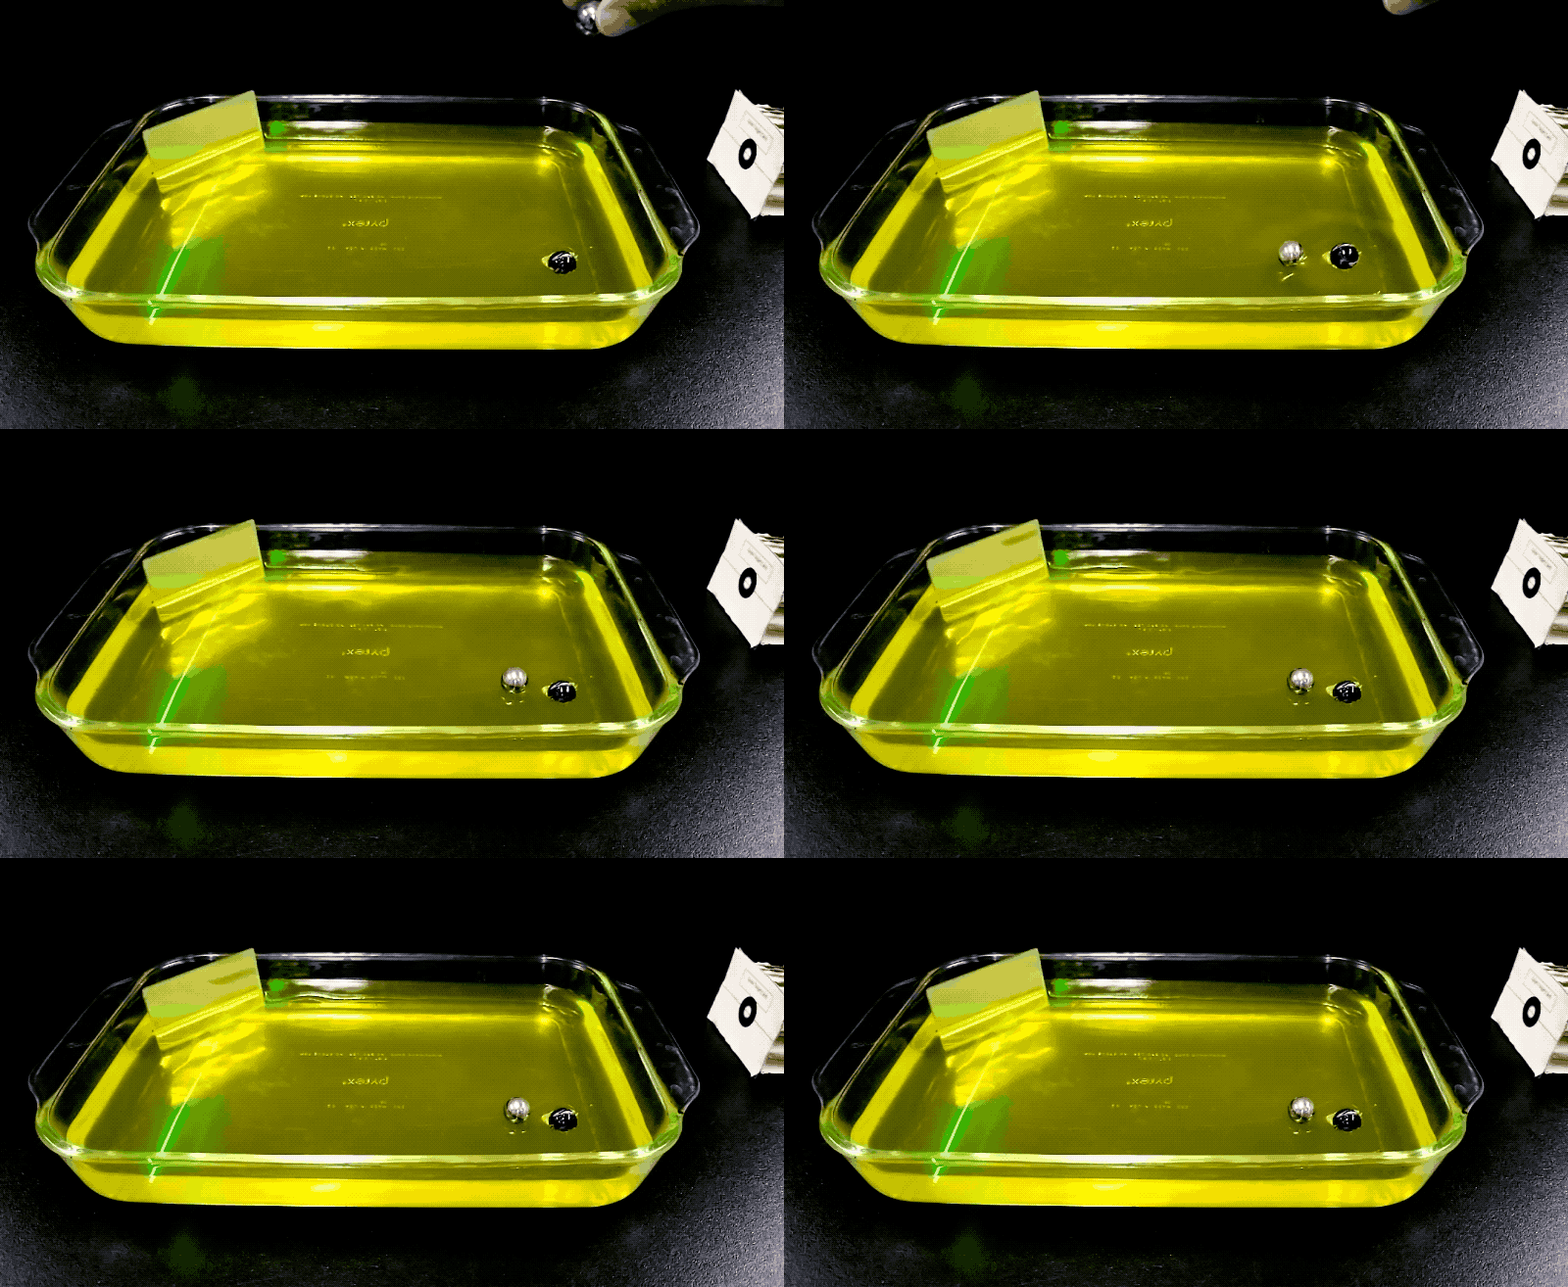
Science Fair Lessons for Educators
Teach students how to craft their own science and engineering fair project with these video tutorials and lessons featuring NASA missions and science.
-
 Collection
Science Fair Activities for Students
Learn how to design a science and engineering fair project and get inspired with our catalog of student projects featuring NASA missions and science.
January
Explore STEM Careers
January is the time when many of us set goals for the year ahead, so it's the perfect month to get students exploring their career goals and opportunities in STEM. Students can learn more about careers in STEM and hear directly from scientists and engineers working on NASA missions in our Teaching Space video series. Meanwhile, our news page has more on what it takes to be a NASA astronaut and what it's like to be a JPL intern.
For students already in college and pursuing STEM degrees, now is the time to start exploring internship opportunities for the summer. The deadline for JPL summer internships is in March, so it's a good idea to refresh your resume and get your application started now. Learn how to stand out with this article on how to get an internship at JPL – which also includes advice for pre-college students.
Resources:
-
 Expert Talks
Teaching Space With NASA
Hear from experts and education specialists about the latest missions and science happening at NASA and get your questions answered.
-
 Articles
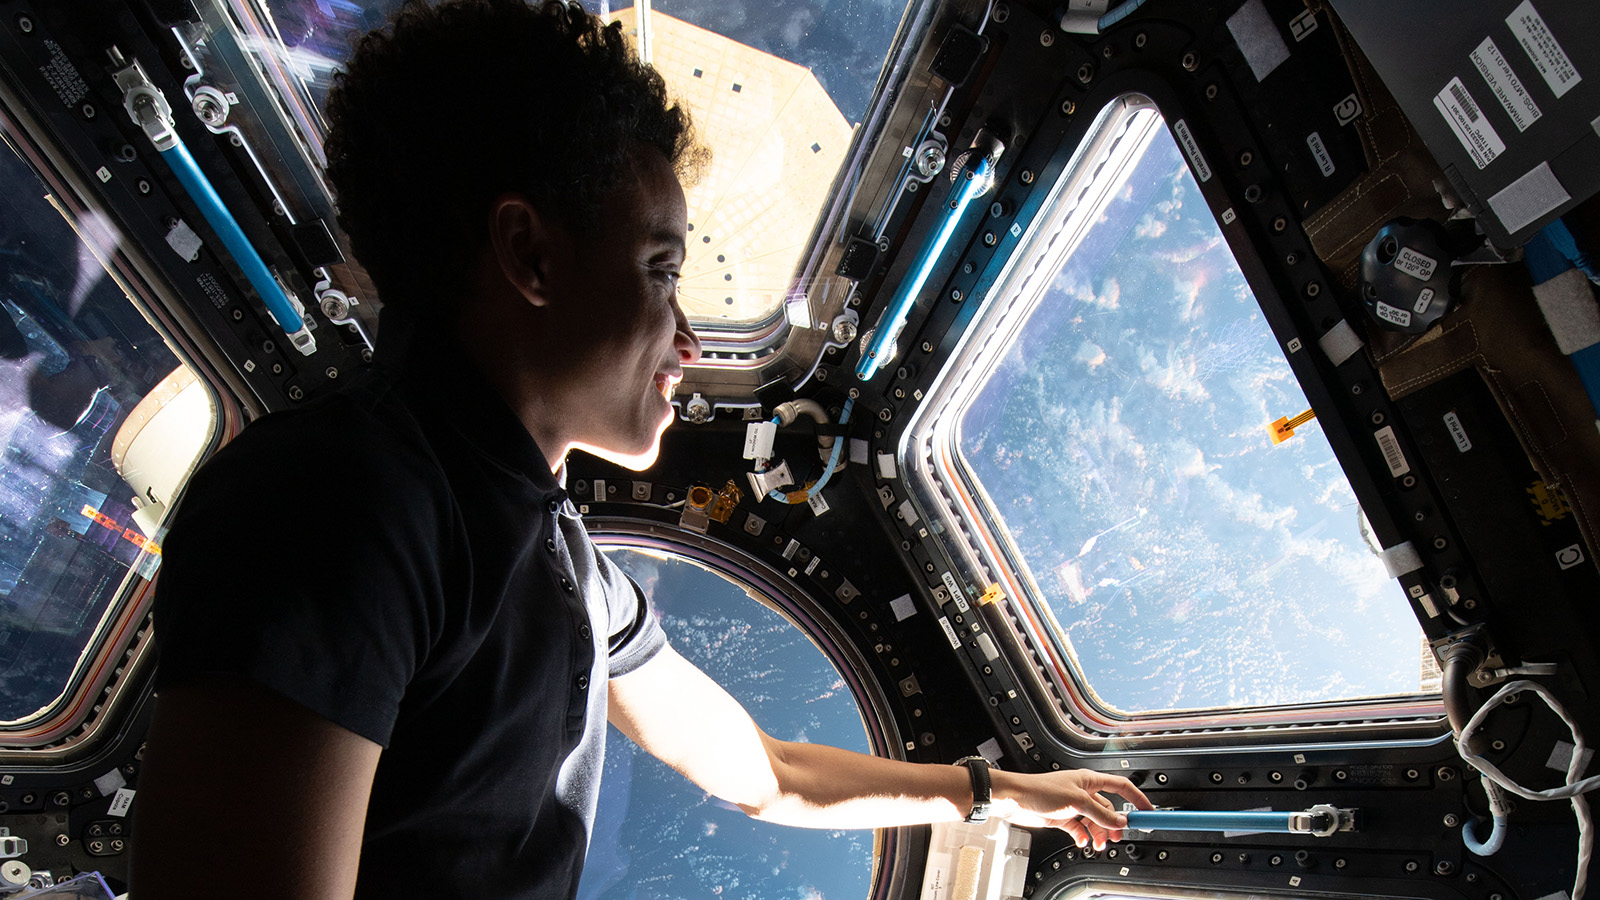
Career Guidance
Get advice from scientists, engineers and educators about what it takes to work in science, technology, engineering and mathematics fields and how to get a foot in the door.
-
 Articles
Meet JPL Interns
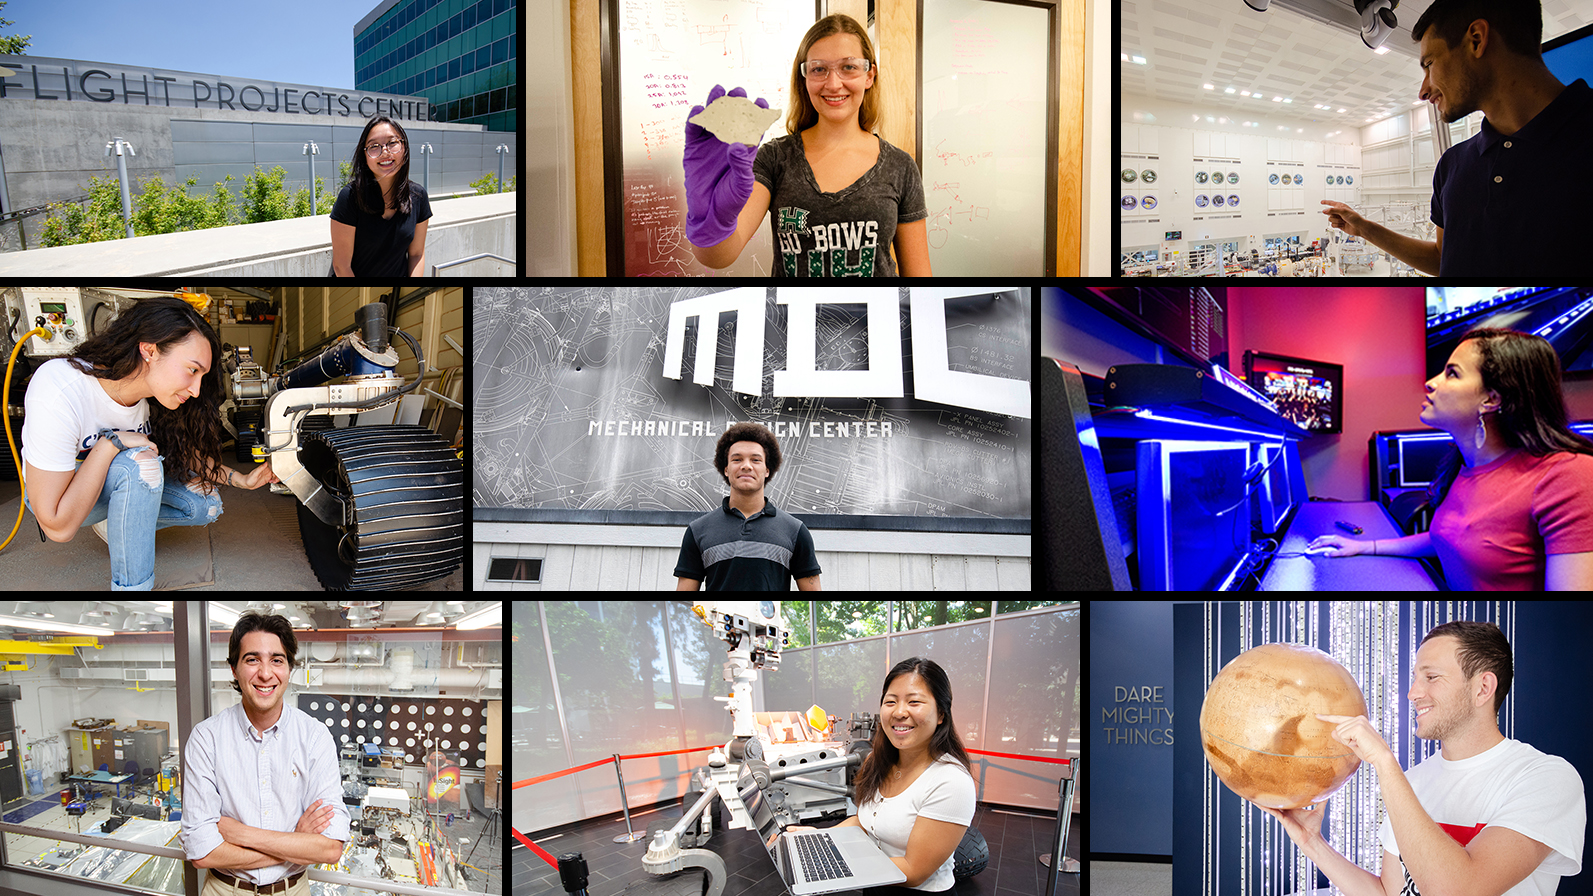
These interns are pushing the boundaries of space exploration and science at the leading center for robotic exploration of the solar system.
-
 Opportunities
JPL Internships and Fellowships
Discover exciting internships and research opportunities at the leading center for robotic exploration of the solar system.
-
 Opportunities
JPL Jobs: Opportunities for Students
Start here to learn more about internship, fellowship, and postdoc opportunities at JPL and how to apply.
-
 Opportunities
NASA Internships
Learn about internship opportunities at NASA centers across the U.S., and apply today!
February
Mars Rover Celebrates 2-Year 'Landiversary'
NASA's Perseverance Mars rover celebrates its "landiversary" on February 18, which marks two years since the rover made its nail-biting descent on the Red Planet. The rover continues to explore Jezero Crater using science tools to analyze rocks and soil in search of signs of ancient microbial life. As of this writing, the rover has collected twelve rock core samples that will be sent to Earth by a future mission. Perseverance even witnessed a solar eclipse! Meanwhile, the Ingenuity Mars helicopter, which the rover deployed shortly after landing, has gone on to achieve feats of its own.
The Mission to Mars Student Challenge is a great way to get students of all ages exploring STEM and the Red Planet right along with the Perseverance rover. The challenge includes seven weeks of education content that can be customized for your classroom as well as education plans, expert talks, and resources from NASA.
Lessons & Resources:
-
 Collection
Mission to Mars Student Challenge
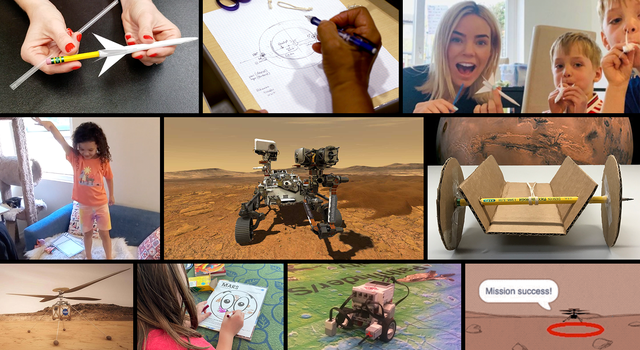
Get K-12 students exploring Mars with NASA scientists, engineers, and the Perseverance rover as they learn all about STEM and design their very own mission to the Red Planet!
-
 Teachable Moments
NASA's Perseverance Rover Lands on Mars
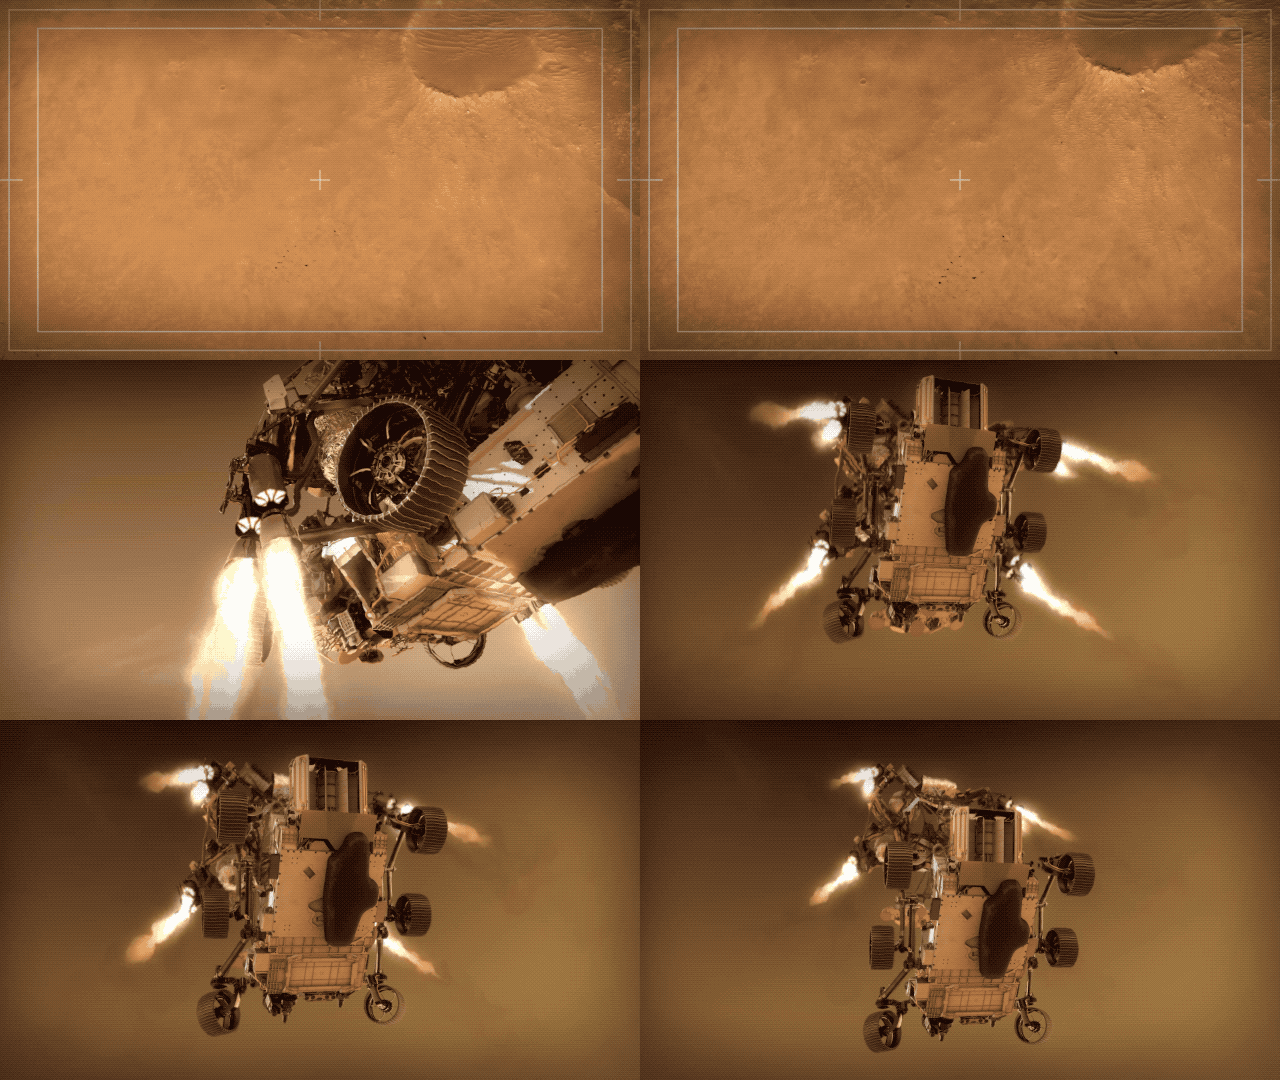
Learn how, why, and what Perseverance will explore on Mars, plus find out about an exciting opportunity for you and your students to join in the adventure!
March
Take On the Pi Day Challenge
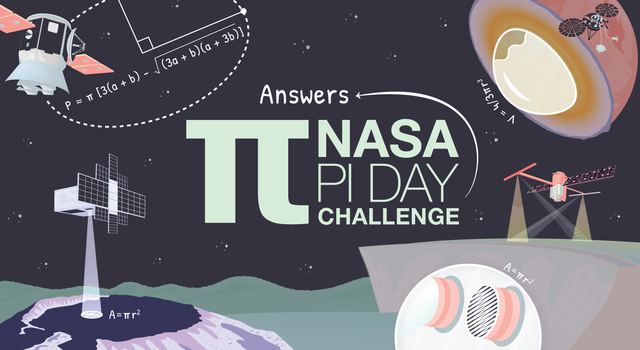
Math teachers, pie-lovers, and pun-aficionados rejoice! March 14 is Pi Day, the annual celebration of the mathematical constant used throughout the STEM world – and especially for space exploration. This year's celebration brings the 10th installment of the NASA Pi Day Challenge, featuring four new illustrated math problems involving pi along with NASA missions and science.
Explore the full collection of pi math lessons, get students learning about how we use pi at NASA, and hear from a JPL engineer on how many decimals of pi we use for space exploration at the links below.
Lessons & Resources:
-
 Teachable Moments
10 Years of NASA's Pi Day Challenge
Learn more about pi, the history of Pi Day before, and the science behind the 2023 NASA Pi Day Challenge.
-
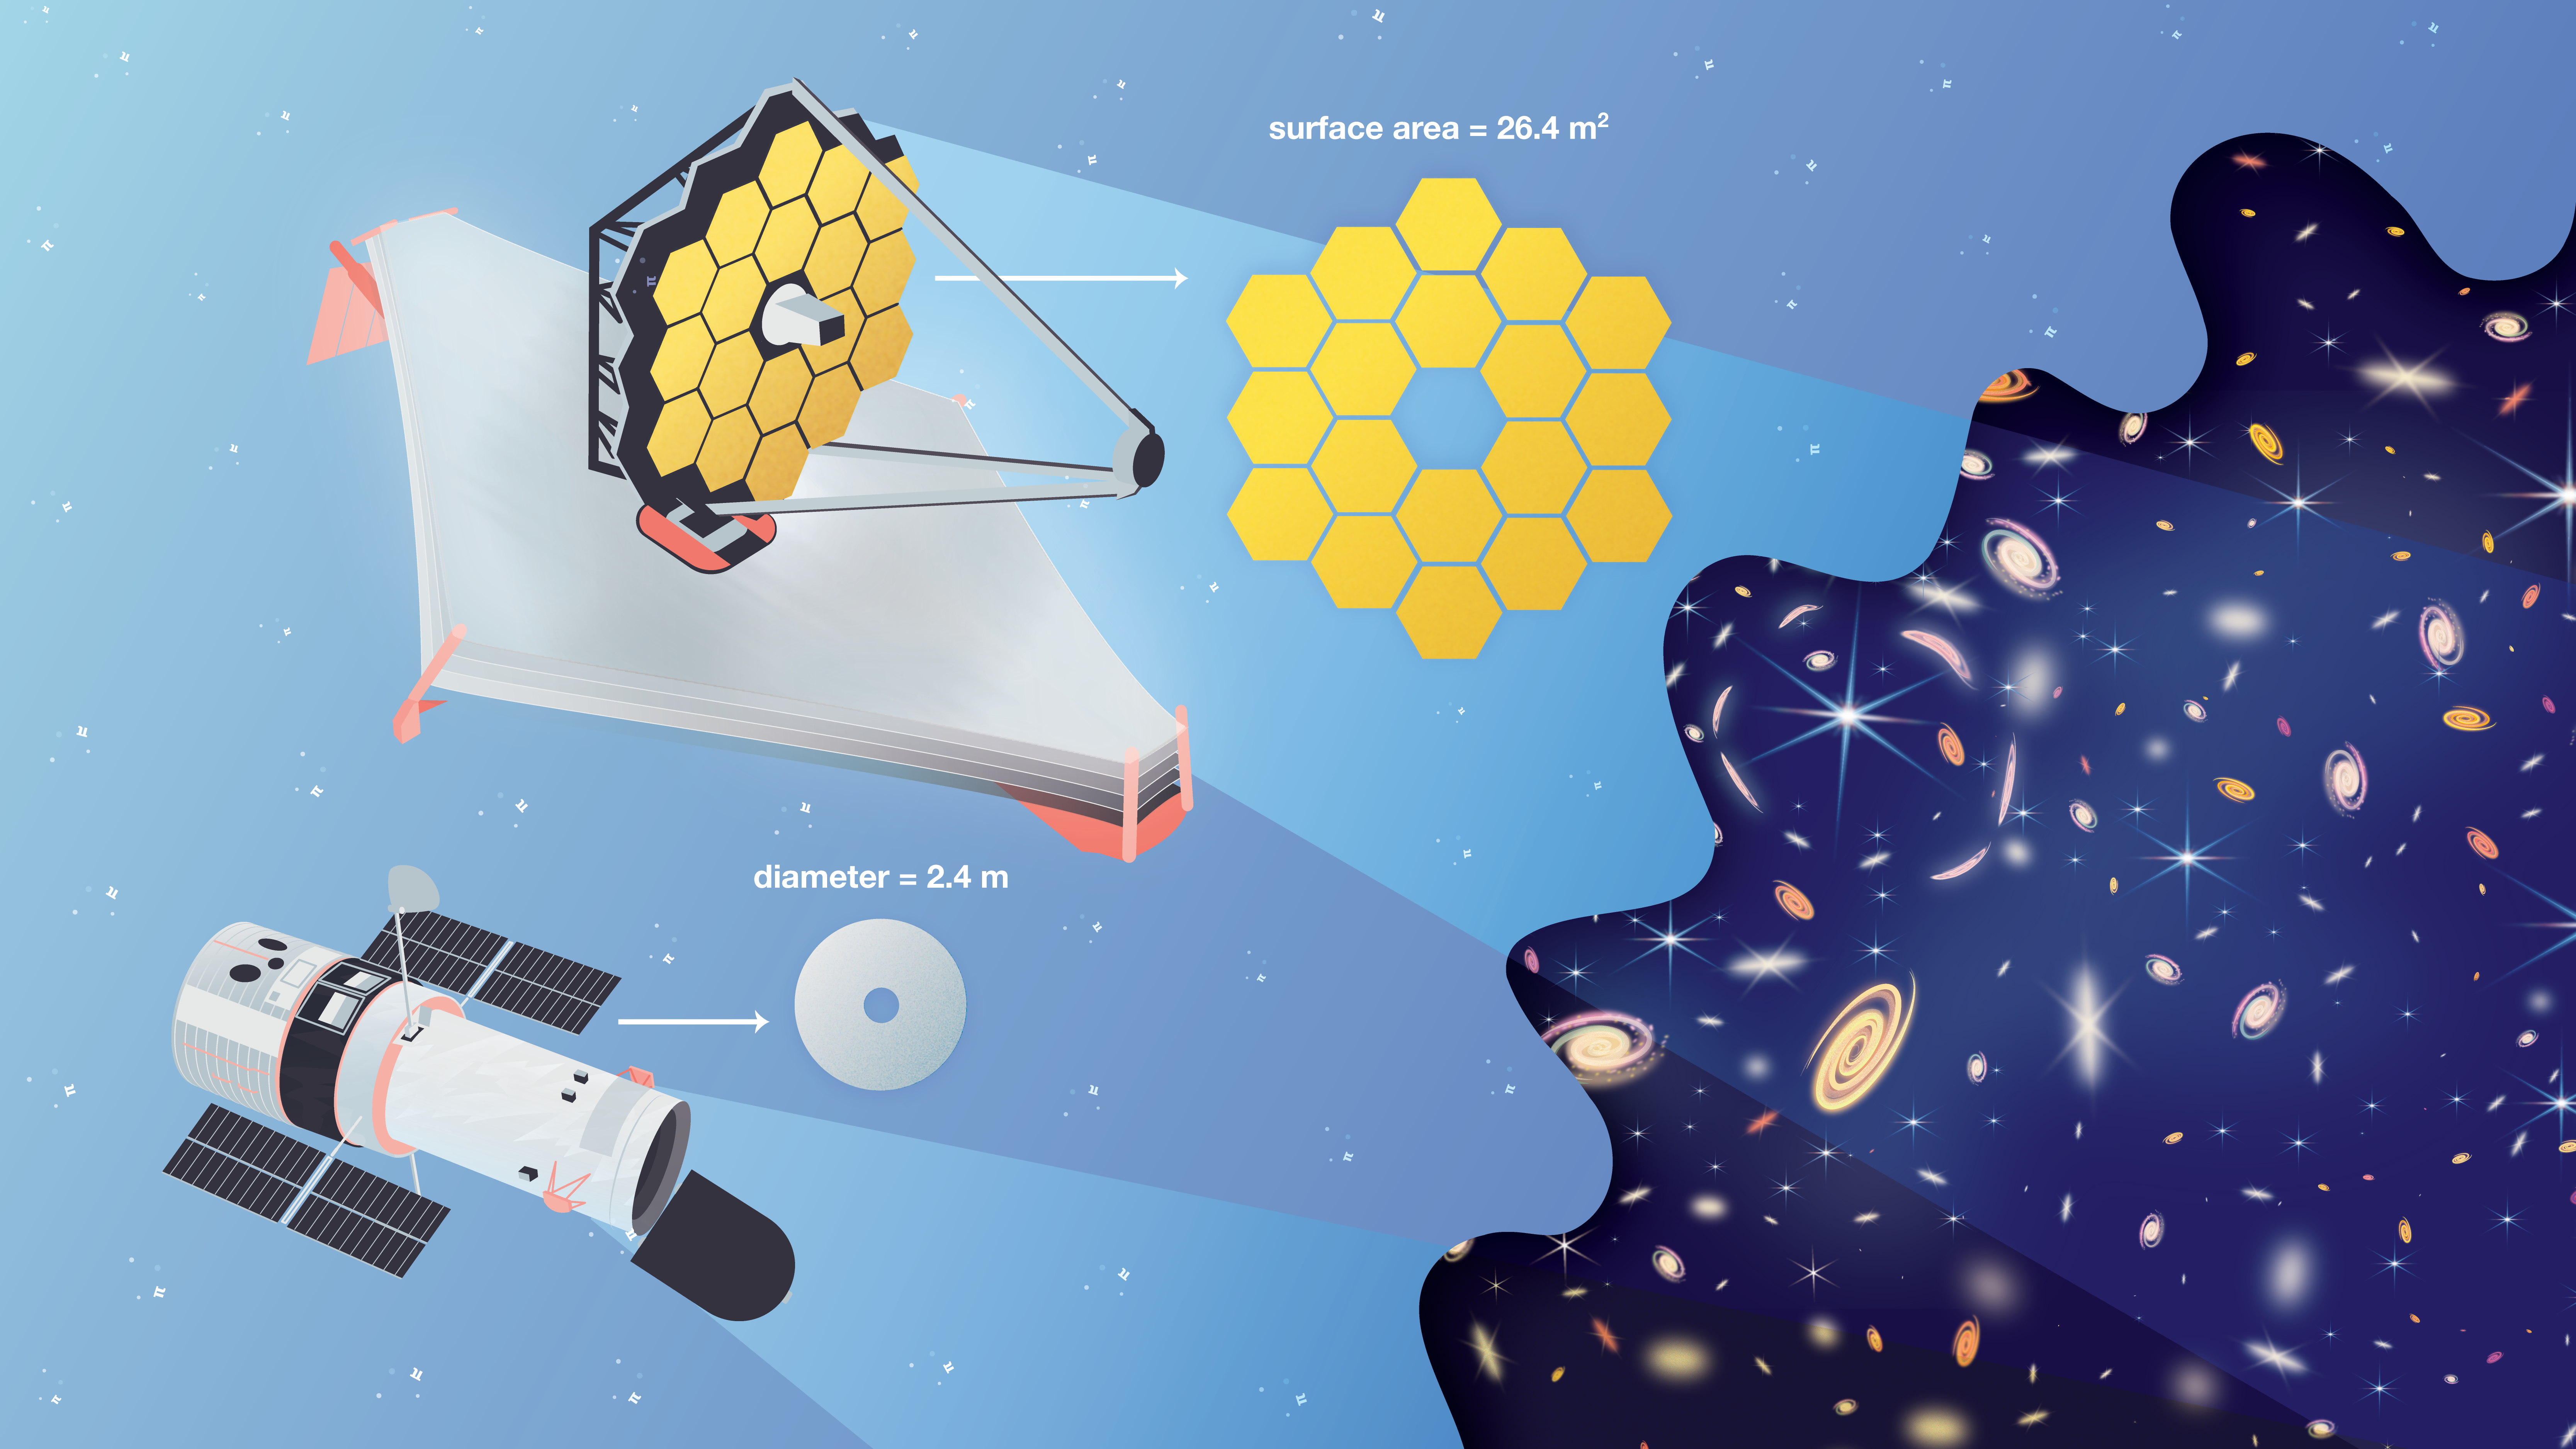 Collection
Pi in the Sky Lessons
Find everything you need to bring the NASA Pi Day Challenge into the classroom, including printable handouts of each illustrated math problem.
-
 Student Project
NASA Pi Day Challenge
This collection of illustrated math problems gets students using pi like NASA scientists and engineers exploring Earth and space.
-
 Article
How Many Decimals of Pi Do We Really Need?
While you may have memorized more than 70,000 digits of pi, world record holders, a JPL engineer explains why you really only need a tiny fraction of that for most calculations.
-
 Article
18 Ways NASA Uses Pi
Whether it's sending spacecraft to other planets, driving rovers on Mars, finding out what planets are made of or how deep alien oceans are, pi takes us far at NASA. Find out how pi helps us explore space.
April
Celebrate Earth Day With NASA
You may not immediately think of Earth science when you think of NASA, but it's a big part of what we do. Earth Day on April 22 is a great time to explore Earth science with NASA, especially as new missions are taking to the skies to study the movements of dust, measure surface water across the planet, and track tiny land movements to better predict natural disasters.
Whether you want to focus on Earth’s surface and geology, climate change, extreme weather, or the water budget, we have an abundance of lessons, student projects and Teachable Moments to guide your way.
Lessons & Resources:
-
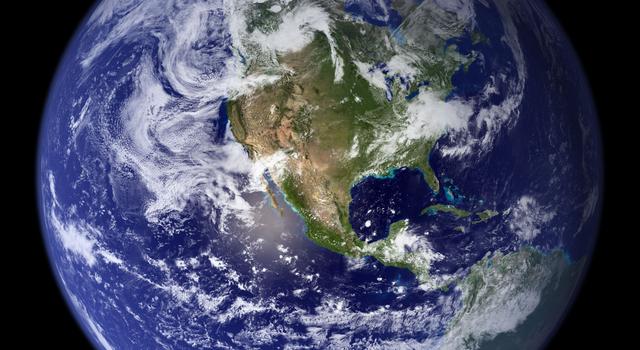 Collection
Earth Lessons for Educators
Discover a collection of standards-aligned STEM lessons all about Earth and climate change.
-
 Collection
Earth Activities for Students
Try these science and engineering projects, watch videos, and explore images all about the planet that we call home.
-
 Teachable Moments
Climate Change Collection
Explore this collection of Teachable Moments articles to get a primer on the latest NASA Earth science missions, plus find related education resources you can deploy right away!
May
Summer Learning Adventures
As the school year comes to a close, send your students off on an adventure of summer learning with our do-it-yourself STEM projects. Additionally, our Learning Space With NASA at Home page and video series is a great resource for parents and families to help direct students' learning during out-of-school time.
Lessons & Resources:
-
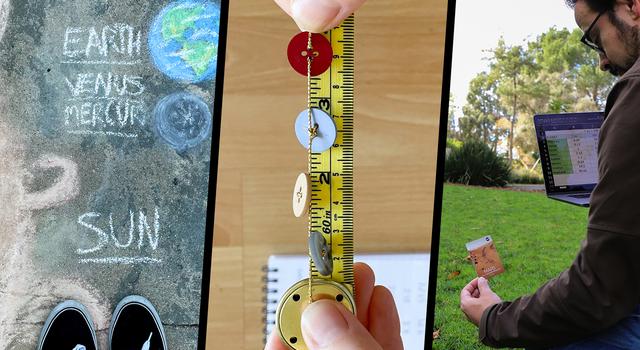 Student Resources
Summer Activities for Students
Explore Earth and space with these hands-on projects, slideshows, videos, and more for K-12 students.
-
 Student Resources
Learning Space With NASA
Explore space and science activities you can do with NASA at home. Find video tutorials, DIY projects, slideshows, games and more!
TAGS: K-12 Education, Teachers, Students, Lessons, Resources, Projects, Events, Artemis, Voyager, DART, Asteroids, Europa, Ocean Worlds, Halloween, History, Earth, Climate, SWOT, Lunar Eclipse, Science Fair, Career Advice, Mars, Perseverance, Pi Day, Earth Day, Summer STEM
Teachable Moments | May 2, 2022
How NASA Plans to Dig Up the Dirt on Climate Change
Learn about the role that dust plays in Earth's climate, why scientists are interested in studying dust from space, and how to engage students in the science with STEM resources from JPL.
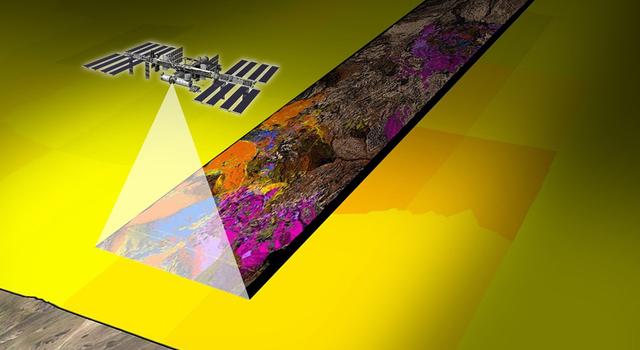
A NASA instrument launched to the International Space Station this summer will explore how dust impacts global temperatures, cloud formation, and the health of our oceans. The Earth Surface Mineral Dust Source Investigation, or EMIT, is the first instrument of its kind, designed to collect measurements from space of some of the most arid regions on Earth to understand the composition of soils that generate dust and the larger role dust plays in climate change.
Read on to find out how the instrument works and why scientists are hoping to learn more about the composition of dust. Then, explore how to bring the science into your classroom with related climate lessons that bridge physical sciences with engineering practices.
Why It’s Important
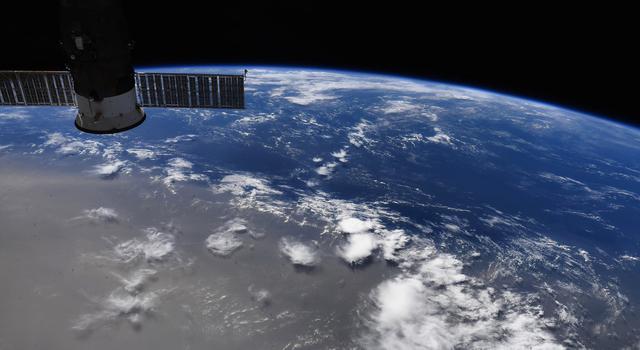
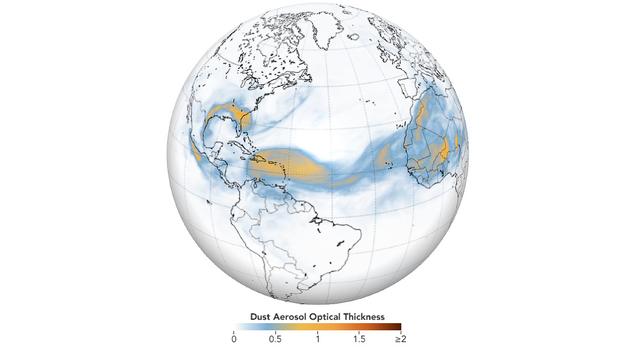
Scientists have long studied the movements of dust. The fact that dust storms can carry tiny particles great distances was reported in the scientific literature nearly two centuries ago by none other than Charles Darwin as he sailed across the Atlantic on the HMS Beagle. What still remains a mystery all these years later is what that dust is made of, how it moves, and how that affects the health of our planet.
For example, we now know that dust deposited on snow speeds up snow melt even more than increased air temperature. That is to say, that dust traveling to cold places can cause increased snow melt.

A coating of dust on snow speeds the pace of snowmelt in the spring. Credit: NASA | + Expand image
Dust can affect air temperatures as well. For example, dust with more iron absorbs light and can cause the air to warm, while dust with less iron reflects light and is responsible for local cooling. Iron in dust can also act as a fertilizer for plankton in oceans, supplying them with nutrients needed for growth and reproduction.

A plume of dust is shown emanating from over Alaska's Copper River in October 2016 in these images captured by the Moderate Resolution Imaging Spectroradiometer, or MODIS, instrument on NASA’s Terra and Aqua satellites. Dust storms play a key role in fueling phytoplankton blooms by delivering iron to the Gulf of Alaska. Credit: NASA | › Full image and caption
Floating dust potentially alters the composition of clouds and how quickly or slowly they form, which can ultimately impact weather patterns, including the formation of hurricanes. That’s because clouds need particles to act as seeds around which droplets of moisture in the atmosphere can form. This process of coalescing water particles, called nucleation, is one factor in how clouds form.
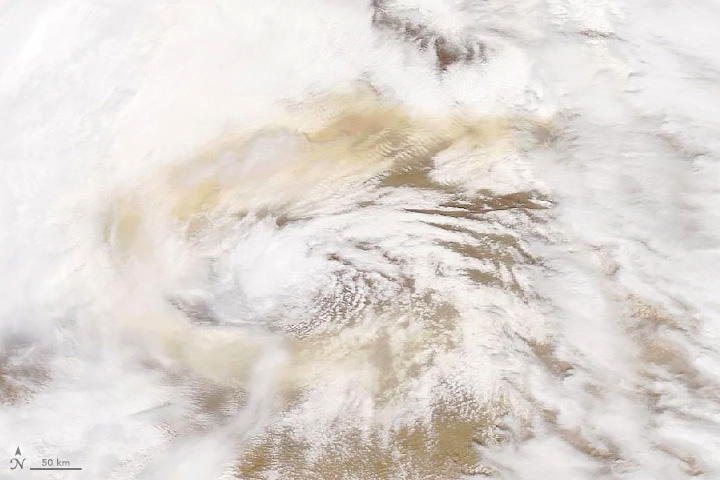
A swirl of dust mixes with the clouds in a low-pressure storm over the Gobi desert between Mongolia and China. This image was captured by the MODIS instrument on the Terra satellite in May 2019. Credit: NASA | › Full image and caption
Thanks to EMIT, we’ll take the first steps in understanding how the movements of dust particles contribute to local and global changes in climate by producing “mineral maps”. These mineral maps will reveal differences in the chemical makeup of dust, providing essential information to help us model the way dust can transform Earth’s climate.
› Learn more about what EMIT will do from JPL News
How It Works
NASA has been exploring how dust moves across the globe by combining on-the-ground field studies with cutting-edge technology.
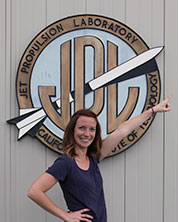
Dr. Olga Kalashnikova, an aerosol scientist at NASA's Jet Propulsion Laboratory and a co-investigator for EMIT, has been using satellite data to study atmospheric mineral dust for many years, including tracking the movements of dust and investigating trends in the frequency of dust storms.
As Dr. Kalashnikova describes, “From the ground, we can see what types of dusts are lifted into the atmosphere by dust storms on a local scale, but with EMIT, we can understand how they differ and where they originally came from.”
EMIT is the first instrument designed to observe a key part of the mineral dust cycle from space, allowing scientists to track different dust compositions on a global scale, instead of in just one region at a time. To understand dust’s impact on Earth’s climate, scientists will use EMIT to answer key questions, including:
- How does dust uplifted in the atmosphere alter global temperatures?
- What role do dusts play in fertilizing our oceans when they are deposited?
- How do dust particles in the atmosphere affect cloud nucleation; the process by which clouds are ‘seeded’ and begin to coalesce into larger clouds?

The EMIT instrument will fly aboard the International Space Station, which orbits Earth about once every 90 minutes, completing about 16 orbits per day. Credit: NASA | + Expand image
To achieve its objectives, EMIT will spend 12 months collecting what are called “hyperspectral images” of some of the most arid regions of our planet selected by scientists and engineers as areas of high dust mobility, such as Northern Africa, the Middle East, and the American Southwest.
These images are measurements of light reflected from the Earth below, calibrated to the distinct patterns, or spectra, of light we see when certain minerals are present. The EMIT team has identified 10 minerals that are most common, including gypsum, hematite, and kaolinite.
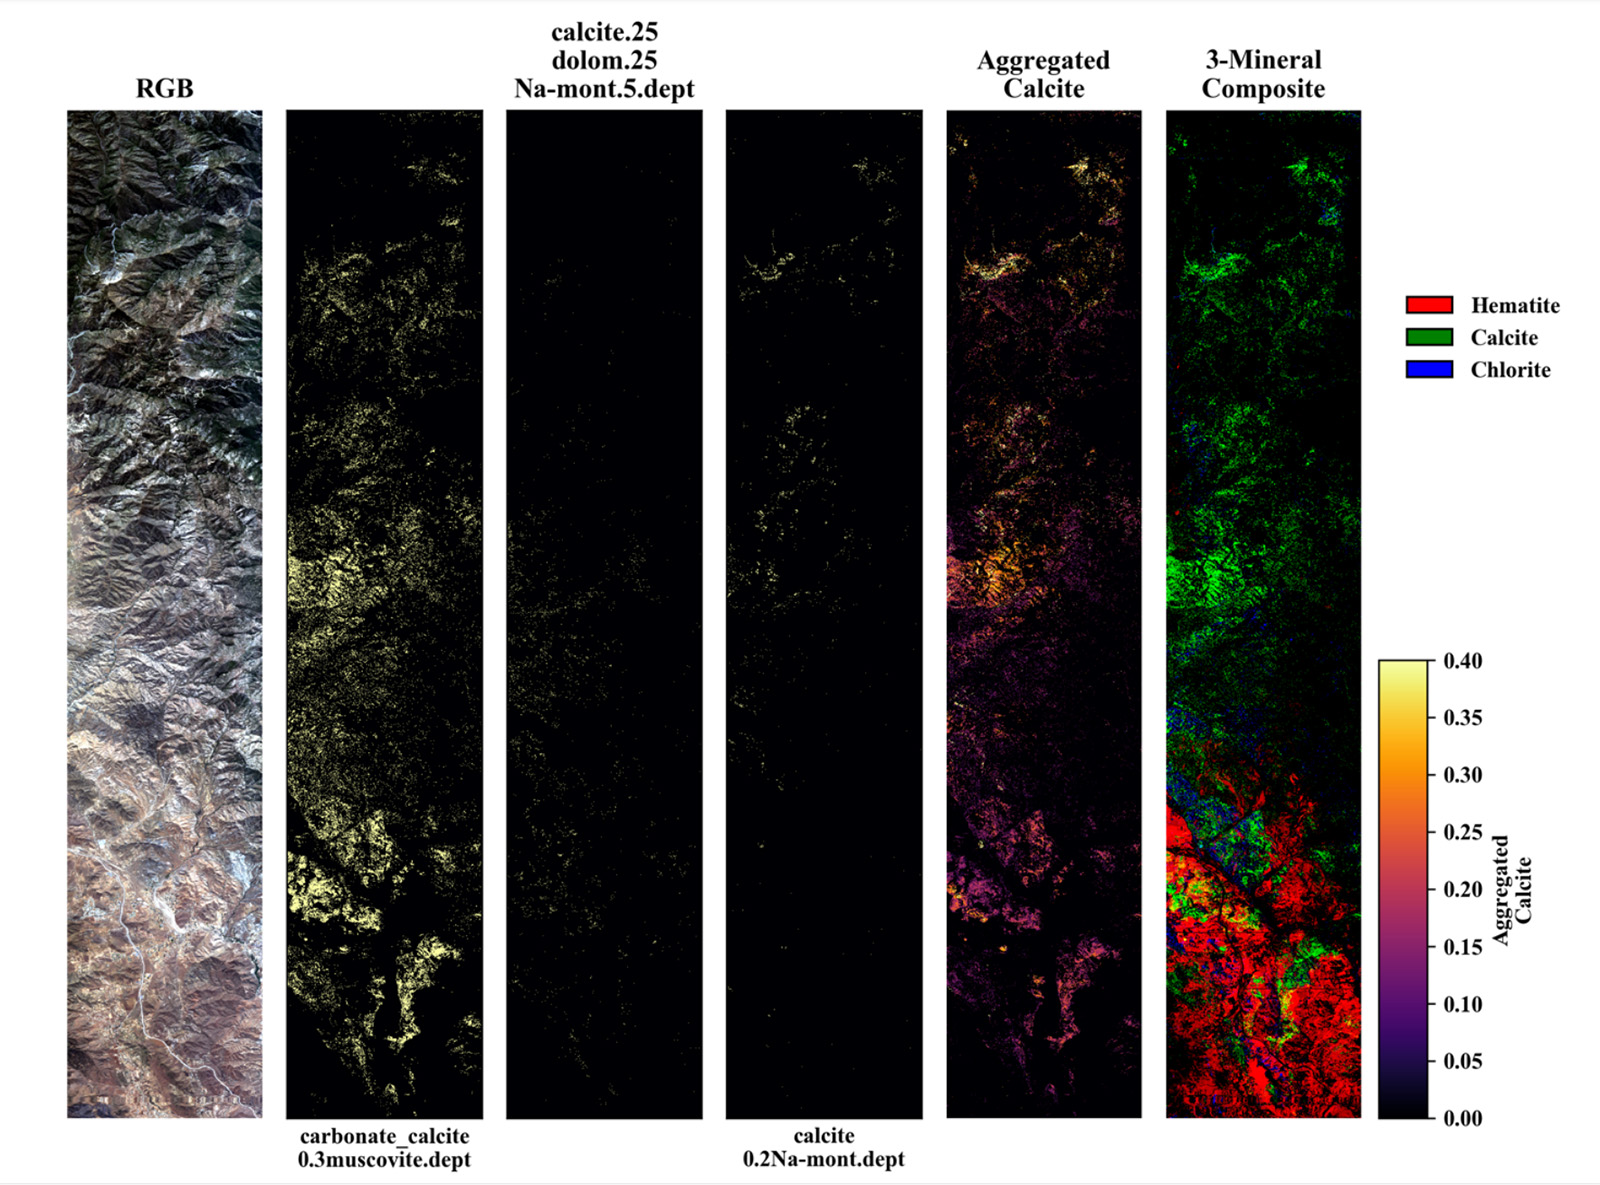
This example spectra shows how scientists will be able to identify different concentrations of minerals and elements in data collected by EMIT. Credit: NASA/JPL-Caltech | + Expand image
Why are these minerals important? One key reason is the presence or absence of the element iron, found in some minerals but not others.
Dr. Bethany Ehlmann is a planetary scientist and co-investigator for the EMIT project at Caltech and explains that when it comes to heating, “a little bit of iron goes a long way.” Iron in minerals absorbs visible and infrared light, meaning that even if only a small amount is present, it will result in a much warmer dust particle. Large amounts of warm dust in our atmosphere may have an impact on temperatures globally since those dust particles radiate heat as they travel, sometimes as far as across oceans!
Collecting images from space is, of course, no easy task, especially when trying to look only at the ground below. Yet it does allow scientists to get a global picture that's not possible to capture from the ground. Field studies allow us to take individual samples from tiny places of interest, but from space, we can scan the entire planet in remote places where no scientist can visit.
Of course, there are some complications in trying to study the light reflected off the surface of Earth, such as interference from clouds. To prevent this problem, the EMIT team plans to collect data at each location several times to ensure that the images aren’t being obscured by clouds between the instrument and the minerals we’re looking for.
The data collected by EMIT will provide a map of the compositions of dust from dry, desert environments all over the world, but the team involved won’t stop there. Knowing more about what the dust is made of sets the stage for a broader understanding of a few more of the complex processes that make up our global climate cycle. Upon completion of this study, EMIT's mineral maps will support further campaigns to complete our global dust picture. For example, NASA hopes to couple the data from EMIT with targeted field campaigns, in which scientists can collect wind-blown dust from the ground to learn more about where dust particles move over time and answer questions about what types of dust are on the go.
Furthermore, missions such as the Multiangle Imager for Aerosols, or MAIA, will allow us to better understand the effects of these dust particles on air-quality and public health.
Teach it
Studying Earth’s climate is a complex puzzle, consisting of many trackable features. These can range from sea level to particles in our atmosphere, but each makes a contribution to measuring the health of our planet. Bring EMIT and NASA Earth Science into your classroom with these lessons, articles, and activities to better understand how we’re exploring climate change.
Educator Guides
-

Ocean World: Earth Globe Toss Game
Students use NASA images and a hands-on activity to compare the amounts of land and surface water on our planet.
Subject Science
Grades K-6
Time Less than 30 mins
-
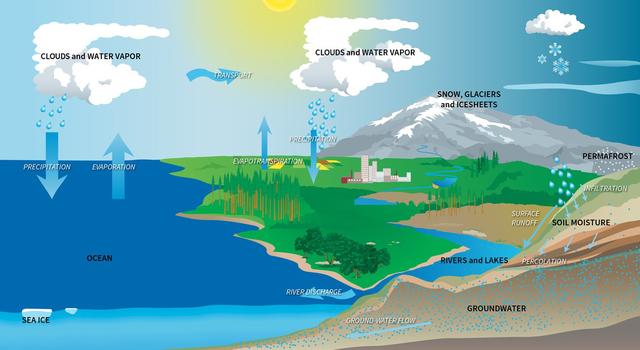
Modeling the Water Budget
Students use a spreadsheet model to understand droughts and the movement of water in the water cycle.
Subject Science
Grades 5-8
Time 30-60 mins
-
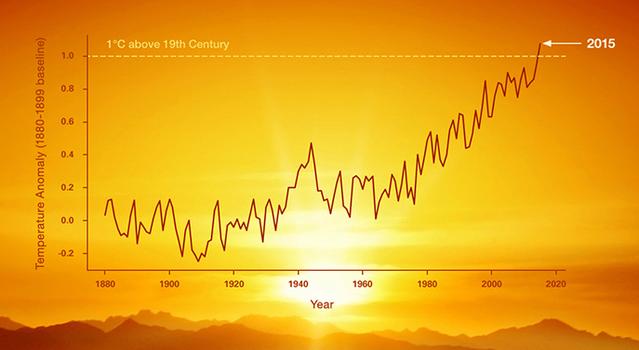
Graphing Global Temperature Trends
Students use global temperature data to create models and compare short-term trends to long-term trends.
Subject Math
Grades 5-12
Time 1-2 hrs
-
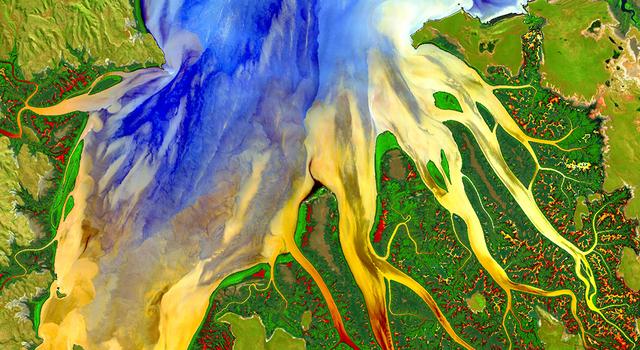
Using Light to Study Planets
Students build a spectrometer using basic materials as a model for how NASA uses spectroscopy to determine the nature of elements found on Earth and other planets.
Subject Science
Grades 6-11
Time > 2 hrs
-

Cloud Computing: A 'Pi in the Sky' Math Challenge
In this illustrated math problem, students use pi to calculate how much water could be contained within a cloud.
Subject Math
Grades 6-12
Time Less than 30 mins
-
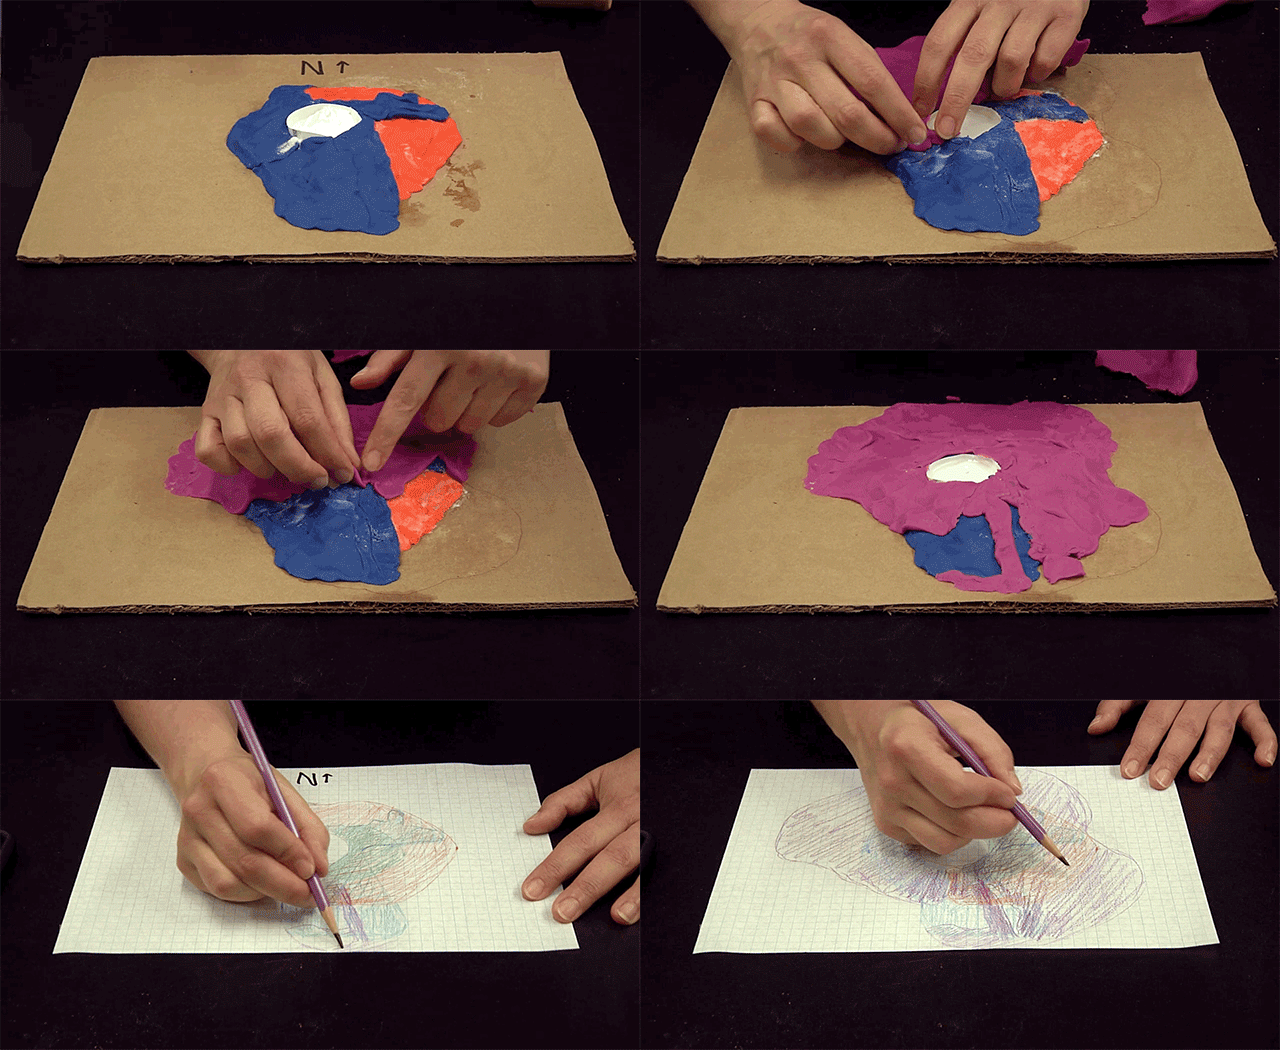
More Earth Science Lessons for Educators
Explore a collection of standards-aligned STEM lessons for students that get them investigating Earth science along with NASA.
Student Activities
-

The Types of Clouds and What They Mean
Learn about cloud types and how they form. Then help NASA scientists studying clouds.
Subject Science
Grades K-3
Time 30-60 mins
-

Make a Cloud in a Bottle
Have you ever wondered how clouds form? In this activity, you can make your own cloud to see for yourself!
Subject Science
Grades 4-12
Time < 30 mins
-
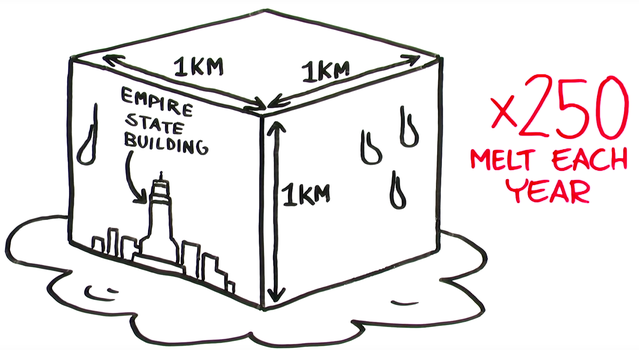
Video Series: NASA's Earth Minute
Learn about the science behind climate change and the NASA missions studying it in these short videos.
Subject Science
Grades 2-12
Time < 30 mins
-
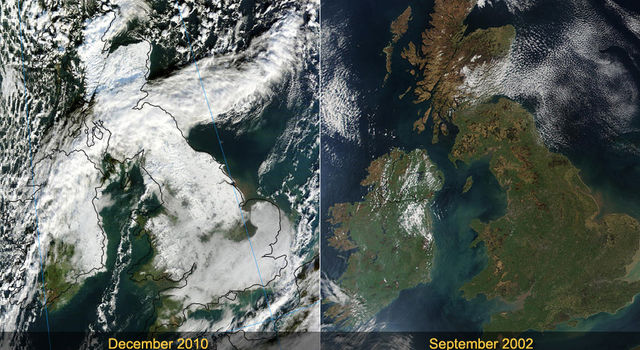
The Change of Seasons: Views from Space
See how seasonal changes affect our planet.
Subject Science
Grades 2-12
Time < 30 mins
-

More Earth Science Activities for Students
Explore Earth science with these projects, videos, and slideshows for students.
Articles
-
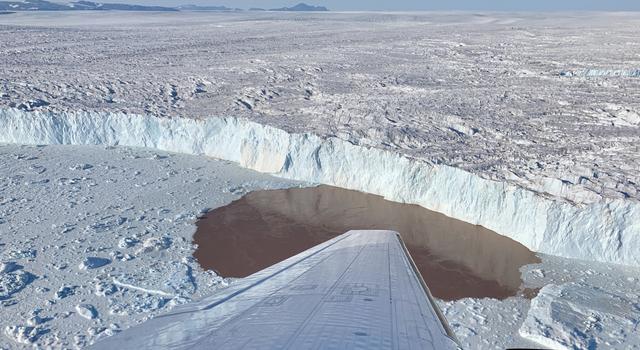 Teachable Moments
Reflecting On Greenland’s Melting Glaciers as OMG Mission Concludes
Explore how the OMG mission discovered more about what's behind one of the largest contributors to global sea level rise.
-
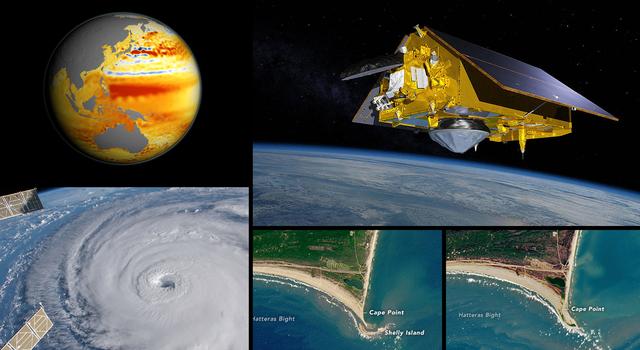 Teachable Moments
Earth Satellite Joins NASA Fleet to Monitor Sea Level, Improve Weather Forecasts
Learn about the mission and find out how to make classroom connections to NASA Earth science – plus explore related teaching and learning resources.
-
 Teachable Moments
Climate Change Collection
Explore this collection of Teachable Moments articles to get a primer on the latest NASA Earth science missions, plus find related education resources you can deploy right away!
Websites
- NASA Climate Change
- NASA Earth Observatory - Images of Dust and Haze
- NASA Climate Kids
- Recursos En Español: NASA Climate Change
TAGS: Earth, climate, geology, weather, EMIT, Teachers, Classroom, Lessons, Earth Science, Climate Change, Dust, Global Warming, Educators, K-12, Teachable Moments, Climate TM
Teachable Moments | March 10, 2022
Pi Goes to Infinity and Beyond in NASA Challenge
Learn about pi and some of the ways the number is used at NASA. Then, dig into the science behind the Pi Day Challenge.
Update: March 15, 2022 – The answers are here! Visit the NASA Pi Day Challenge slideshow to view the illustrated answer keys for each of the problems in the 2022 challenge.
In the News
No matter what Punxsutawney Phil saw on Groundhog Day, a sure sign that spring approaches is Pi Day. Celebrated on March 14, it’s the annual holiday that pays tribute to the mathematical constant pi – the number that results from dividing any circle's circumference by its diameter.
Every year, Pi Day gives us a reason to not only celebrate the mathematical wonder that helps NASA explore the universe, but also to enjoy our favorite sweet and savory pies. Students can join in the fun by using pi to explore Earth and space themselves in our ninth annual NASA Pi Day Challenge.
Read on to learn more about the science behind this year's challenge and find out how students can put their math mettle to the test to solve real problems faced by NASA scientists and engineers as we explore Earth, the Moon, Mars, and beyond!
Visit the Pi in the Sky 9 lesson page to explore classroom resources and downloads for the 2022 NASA Pi Day Challenge. Image credit: NASA/JPL-Caltech | + Expand image

This artist's concept shows the Lunar Flashlight spacecraft, a six-unit CubeSat designed to search for ice on the Moon's surface using special lasers. Image credit: NASA/JPL-Caltech | › Full image details
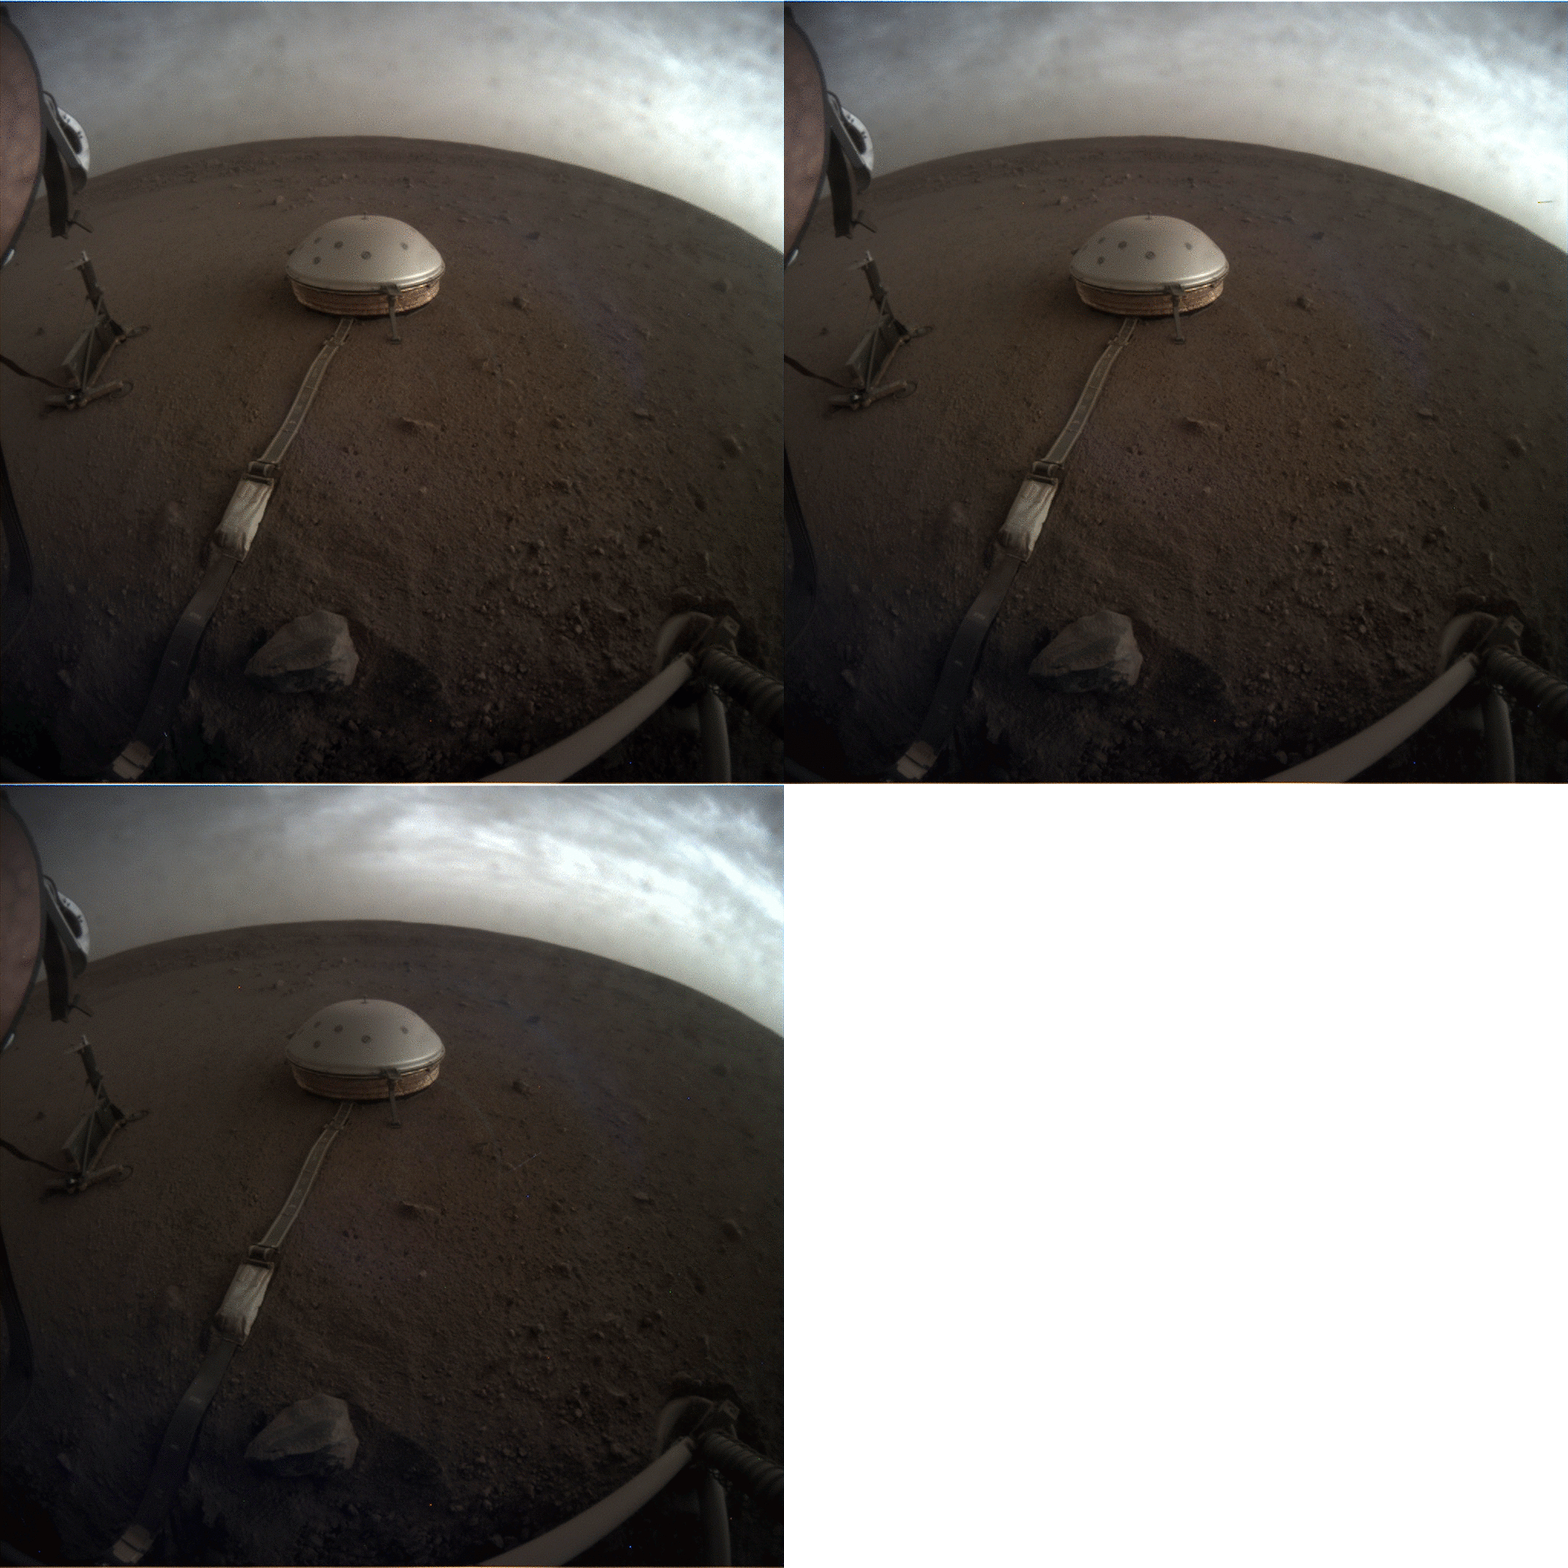
Clouds drift over the dome-covered seismometer, known as SEIS, belonging to NASA's InSight lander, on Mars. Credit: NASA/JPL-Caltech. | › Full image and caption

This animation shows the collection of data over the state of Florida, which is rich with rivers, lakes and wetlands. Credits: NASA/JPL-Caltech | + Expand image

Illustration of NASA’s Transiting Exoplanet Survey Satellite, or TESS. Credit: NASA | + Expand image
How It Works
Dividing any circle’s circumference by its diameter gives you an answer of pi, which is usually rounded to 3.14. Because pi is an irrational number, its decimal representation goes on forever and never repeats. In 2021, a supercomputer calculated pi to more than 62 trillion digits. But you might be surprised to learn that for space exploration, NASA uses far fewer digits of pi.
Here at NASA, we use pi to understand how much signal we can receive from a distant spacecraft, to calculate the rotation speed of a Mars helicopter blade, and to collect asteroid samples. But pi isn’t just used for exploring the cosmos. Since pi can be used to find the area or circumference of round objects and the volume or surface area of shapes like cylinders, cones, and spheres, it is useful in all sorts of ways. Architects use pi when designing bridges or buildings with arches; electricians use pi when calculating the conductance of wire; and you might even want to use pi to figure out how much frozen goodness you are getting in your ice cream cone.
In the United States, March 14 can be written as 3.14, which is why that date was chosen for celebrating all things pi. In 2009, the U.S. House of Representatives passed a resolution officially designating March 14 as Pi Day and encouraging teachers and students to celebrate the day with activities that teach students about pi. And that's precisely what the NASA Pi Day Challenge is all about!
The Science Behind the 2022 NASA Pi Day Challenge
This ninth installment of the NASA Pi Day Challenge includes four brain-busters that get students using pi to measure frost deep within craters on the Moon, estimate the density of Mars’ core, calculate the water output from a dam to assess its potential environmental impact, and find how far a planet-hunting satellite needs to travel to send data back to Earth.
Read on to learn more about the science and engineering behind the problems or click the link below to jump right into the challenge.
› Take the NASA Pi Day Challenge
› Educators, get the lesson here!
Lunar Logic
NASA’s Lunar Flashlight mission is a small satellite that will seek out signs of frost in deep, permanently shadowed craters around the Moon’s south pole. By sending infrared laser pulses to the surface and measuring how much light is reflected back, scientists can determine which areas of the lunar surface contain frost and which are dry. Knowing the locations of water-ice on the Moon could be key for future crewed missions to the Moon, when water will be a precious resource. In Lunar Logic, students use pi to find out how much surface area Lunar Flashlight will measure with a single pulse from its laser.
Core Conundrum
Since 2018, the InSight lander has studied the interior of Mars by measuring vibrations from marsquakes and the “wobble” of the planet as it rotates on its axis. Through careful analysis of the data returned from InSight, scientists were able to measure the size of Mars’ liquid core for the first time and estimate its density. In Core Conundrum, students use pi to do some of the same calculations, determining the volume and density of the Red Planet’s core and comparing it to that of Earth’s core.
Dam Deduction
The Surface Water and Ocean Topography, or SWOT mission will conduct NASA's first global survey of Earth's surface water. SWOT’s state-of-the-art radar will measure the elevation of water in major lakes, rivers, wetlands, and reservoirs while revealing unprecedented detail on the ocean surface. This data will help scientists track how these bodies of water are changing over time and improve weather and climate models. In Dam Deduction, students learn how data from SWOT can be used to assess the environmental impact of dams. Students then use pi to do their own analysis, finding the powered output of a dam based on the water height of its reservoir and inferring potential impacts of this quick-flowing water.
Telescope Tango
The Transiting Exoplanet Survey Satellite, or TESS, is designed to survey the sky in search of planets orbiting bright, nearby stars. TESS does this while circling Earth in a unique, never-before-used orbit that brings the spacecraft close to Earth about once every two weeks to transmit its data. This special orbit keeps TESS stable while giving it an unobstructed view of space. In its first two years, TESS identified more than 2,600 possible exoplanets in our galaxy with thousands more discovered during its extended mission. In Telescope Tango, students will use pi to calculate the distance traveled by TESS each time it sends data back to Earth.
Teach It
Celebrate Pi Day by getting students thinking like NASA scientists and engineers to solve real-world problems in NASA Pi Day Challenge. Completing the problem set and reading about other ways NASA uses pi is a great way for students to see the importance of the M in STEM.
Pi Day Resources
-

Pi in the Sky Lessons
Here's everything you need to bring the NASA Pi Day Challenge into the classroom.
Grades 4-12
Time Varies
-

NASA Pi Day Challenge
The entire NASA Pi Day Challenge collection can be found in one, handy slideshow for students.
Grades 4-12
Time Varies
-

How Many Decimals of Pi Do We Really Need?
While you may have memorized more than 70,000 digits of pi, world record holders, a JPL engineer explains why you really only need a tiny fraction of that for most calculations.
-

18 Ways NASA Uses Pi
Whether it's sending spacecraft to other planets, driving rovers on Mars, finding out what planets are made of or how deep alien oceans are, pi takes us far at NASA. Find out how pi helps us explore space.
-
10 Ways to Celebrate Pi Day With NASA on March 14
Find out what makes pi so special, how it’s used to explore space, and how you can join the celebration with resources from NASA.
-
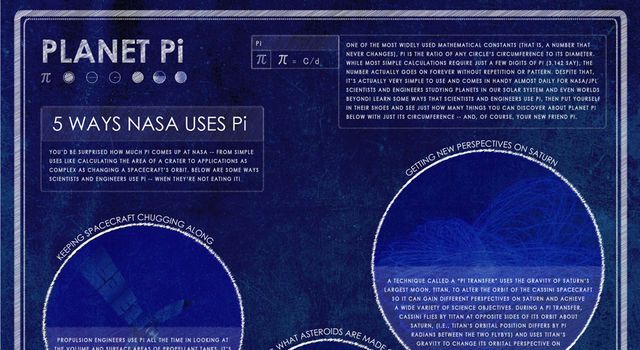
Infographic: Planet Pi
This poster shows some of the ways NASA scientists and engineers use the mathematical constant pi (3.14) and includes common pi formulas.
-

Downloads
Can't get enough pi? Download this year's NASA Pi Day Challenge graphics, including mobile phone and desktop backgrounds:
- Pi in the Sky 9 Poster (PDF, 11.2 MB)
- Lunar Flashlight Background: Phone | Desktop
- Mars InSight Lander Background: Phone | Desktop
- SWOT Mission Background: Phone | Desktop
- TESS Mission - Downlink Background: Phone | Desktop
- TESS Mission - Science Background (not pictured): Phone | Desktop
- Medley Background (not pictured): Phone | Desktop
-
Pi Day: What's Going 'Round
Tell us what you're up to this Pi Day and share your stories and photos on our showcase page.
Plus, join the conversation using the hashtag #NASAPiDayChallenge on Facebook, Twitter, and Instagram.
Recursos en español
Related Lessons for Educators
-

Planetary Egg Wobble and Newton's First Law
Students try to determine the interior makeup of an egg (hard-boiled or raw) based on their understanding of center of mass and Newton’s first law of motion.
Grades 3-8
Time 30 min to 1 hour
-

Whip Up a Moon-Like Crater
Whip up a moon-like crater with baking ingredients as a demonstration for students.
Grades 1-6
Time 30 min to 1 hour
-

Exploring Exoplanets with Kepler
Students use math concepts related to transits to discover real-world data about Mercury, Venus and planets outside our solar system.
Grades 6-12
Time 30 min to 1 hour
-

Tracking Water Using NASA Satellite Data
Using real data from NASA’s GRACE satellites, students will track water mass changes in the U.S.
Grades 4-8
Time 30 min to 1 hour
-

Modeling the Water Budget
Students use a spreadsheet model to understand droughts and the movement of water in the water cycle.
Grades 5-8
Time 30 min to 1 hour
Related Activities for Students
-
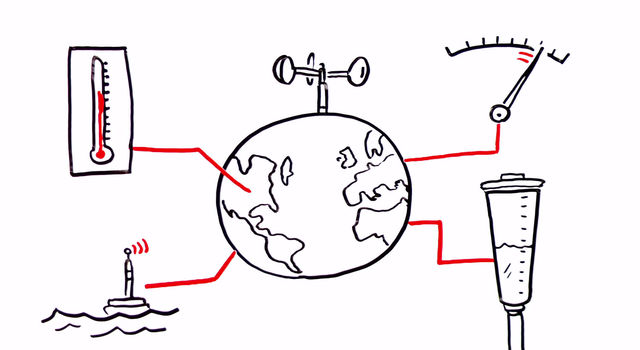
NASA's Earth Minute: Mission to Earth?
NASA doesn't just explore outer space! It studies Earth, too, with a fleet of spacecraft and scientists far and wide.
Type Video
Subject Science
-

Look at the Moon! Journaling Project
Draw what you see in a Moon Journal and see if you can predict the moon phase that comes next.
Type Project
Subject Science
-
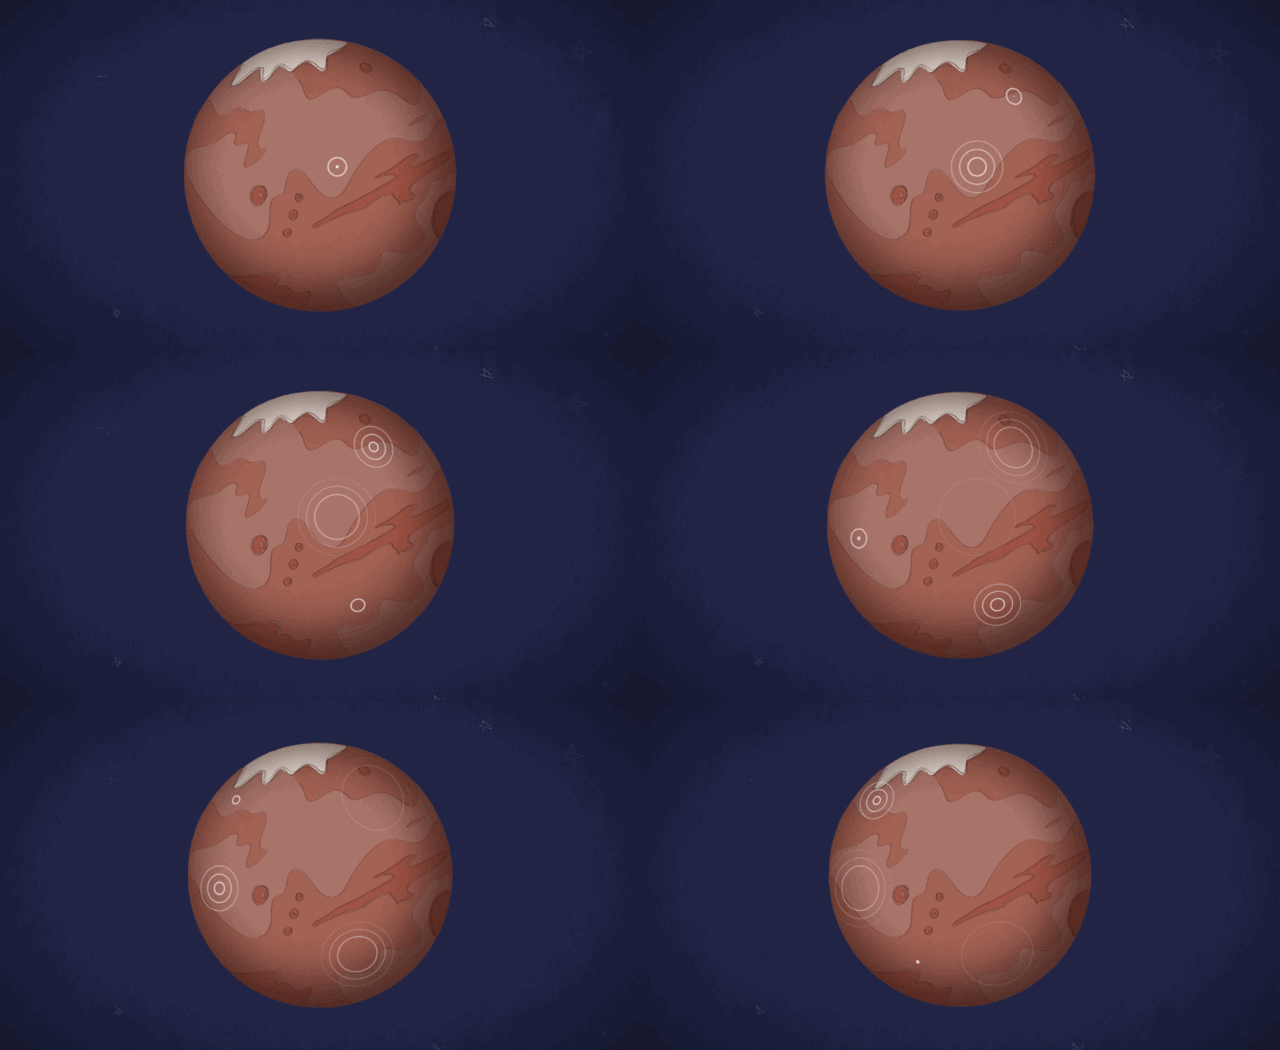
Mars in a Minute: Are There Quakes on Mars?
Are there earthquakes on Mars – or rather, "marsquakes"? What could they teach us about the Red Planet?
Type Video
Subject Science
Explore More
Infographic
Facts and Figures
Missions and Instruments
Websites
TAGS: Pi Day, Pi, Math, NASA Pi Day Challenge, Moon, Lunar Flashlight, Mars, InSight, Earth, Climate, SWOT, Exoplanets, Universe, TESS, Teachers, Educators, Parents, Students, Lessons, Activities, Resources, K-12
Teachable Moments | January 24, 2022
Reflecting On Greenland’s Melting Glaciers as OMG Mission Concludes
Explore how the OMG mission discovered more about what's behind one of the largest contributors to global sea level rise. Plus, learn what it means for communities around the world and how to get students engaged.
After six years investigating the effects of warming oceans on Greenland's ice sheet, the Oceans Melting Greenland, or OMG, mission has concluded. This airborne and seaborne mission studied how our oceans are warming and determined that ocean water is melting Greenland’s glaciers as much as warm air is melting them from above.
Read on to learn more about how OMG accomplished its goals and the implications of what we learned. Then, explore educational resources to engage students in the science of this eye-opening mission.
Why It's Important
Global sea level rise is one of the major environmental challenges of the 21st century. As oceans rise, water encroaches on land, affecting populations that live along shorelines. Around the world – including U.S. regions along the Gulf of Mexico and Eastern Seaboard and in Alaska – residents are feeling the impact of rising seas. Additionally, freshwater supplies are being threatened by encroaching saltwater from rising seas.
Sea level rise is mostly caused by melting land ice (primarily glaciers), which adds water to the ocean, as well as thermal expansion, the increase in volume that occurs when water heats up. Both ice melt and thermal expansion result from rising global average temperatures on land and in the sea – one facet of climate change.
This short video explains why Greenland's ice sheets are melting and what it means for our planet. Credit: NASA/JPL-Caltech | Watch more from the Earth Minute series
Greenland’s melting glaciers contribute more freshwater to sea level rise than any other source, which is why the OMG mission set out to better understand the mechanisms behind this melting.
How We Did It
The OMG mission used a variety of instruments onboard airplanes and ships to map the ocean floor, measure the behemoth Greenland glaciers, and track nearby water temperature patterns.
Join JPL scientist Josh Willis as he and the NASA Oceans Melting Greenland (OMG) team work to understand the role that ocean water plays in melting Greenland’s glaciers. Credit: NASA/JPL-Caltech | Watch on YouTube

This animation shows how the OMG mission created a map of the ocean floor, known as a bathymetric map, to determine the geometry around Greenland's glaciers. Image credit: NASA/JPL-Caltech | + Expand image

This animation shows how the OMG mission used radar to measure changes in the thickness and retreat of Greenland's glaciers as well as probes to measure ocean temperature and salinity. Credit: NASA/JPL-Caltech | + Expand image
Early on, the mission team created a map of the ocean floor, known as a bathymetric map, by combining multibeam sonar surveys taken from ships and gravity measurements taken from airplanes. Interactions among glaciers and warming seas are highly dependent on the geometry of the ocean floor. For example, continental shelf troughs carved by glaciers allow pathways for water to interact with glacial ice. So understanding Greenland's local bathymetry was crucial to OMG's mission.
To locate the edges of Greenland's glaciers and measure their heights, the mission used a radar instrument known as the Glacier and Ice Surface Topography Interferometer. Every spring during the six-year OMG mission, the radar was deployed on NASA’s Gulfstream III airplane that flew numerous paths over Greenland’s more than 220 glaciers. Data from the instrument allowed scientists to determine how the thickness and area of the glaciers are changing over time.
Finally, to measure ocean temperature and salinity patterns, scientists deployed numerous cylindrical probes. These probes dropped from an airplane and fell through the water, taking measurements from the surface all the way to the ocean floor. Each probe relayed its information back to computers onboard the plane where ocean temperatures and salinity were mapped. Then, scientists took this data back to their laboratories and analyzed it for trends, determining temperature variations and circulation patterns.
What We Discovered
Prior to the OMG mission, scientists knew that warming air melted glaciers from above, like an ice cube on a hot day. However, glaciers also flow toward the ocean and break off into icebergs in a process called calving. Scientists had the suspicion that warmer ocean waters were melting the glaciers from below, causing them to break off more icebergs and add to rising seas. It wasn’t until they acquired the data from OMG, that they discovered the grim truth: Glaciers are melting from above and below, and warming oceans are having a significant effect on glacial melt.
This narrated animation shows warm ocean water is melting glaciers from below, causing their edges to break off in a process called calving. Credit: NASA | Watch on YouTube
What this means for our Earth's climate is that as we continue burning fossil fuels and contributing to greenhouse gas accumulation, the oceans, which store more than 90% of the heat that is trapped by greenhouse gases, will continue to warm, causing glaciers to melt faster than ever. As warming ocean water moves against glaciers, it eats away at their base, causing the ice above to break off. In other words, calving rates increase and sea level rises even faster.
Our oceans control our climate and affect our everyday lives, whether or not we live near them. With the pace of the melt increasing, our shorelines and nearby communities will be in trouble sooner than previously expected. And it’s not just the beaches that will be affected. If Greenland’s glaciers all melt, global sea levels will rise by over 24 feet (7.4 meters), bringing dramatic change to the landscapes of major cities around the world.
Teach It
Check out these resources to bring the real-life STEM behind the mission into your teaching. With lessons for educators and student projects, engage students in learning about the OMG mission and NASA climate science.
Educator Guides
-

Melting Ice Experiment
Students make predictions and observations about how ice will melt in different conditions then compare their predictions to results as they make connections to melting glaciers.
Subject Science
Grades 2-12
Time 30-60 mins
-
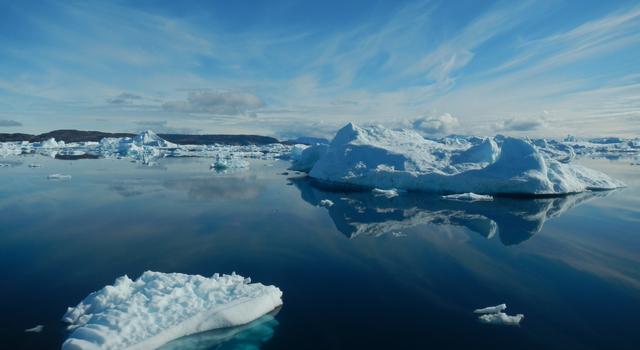
What's Causing Sea-Level Rise? Land Ice Vs. Sea Ice
Students learn the difference between land ice and sea ice and make a model to see how the melting of each impacts global sea level.
Subject Science
Grades 2-8
Time 30-60 mins
-
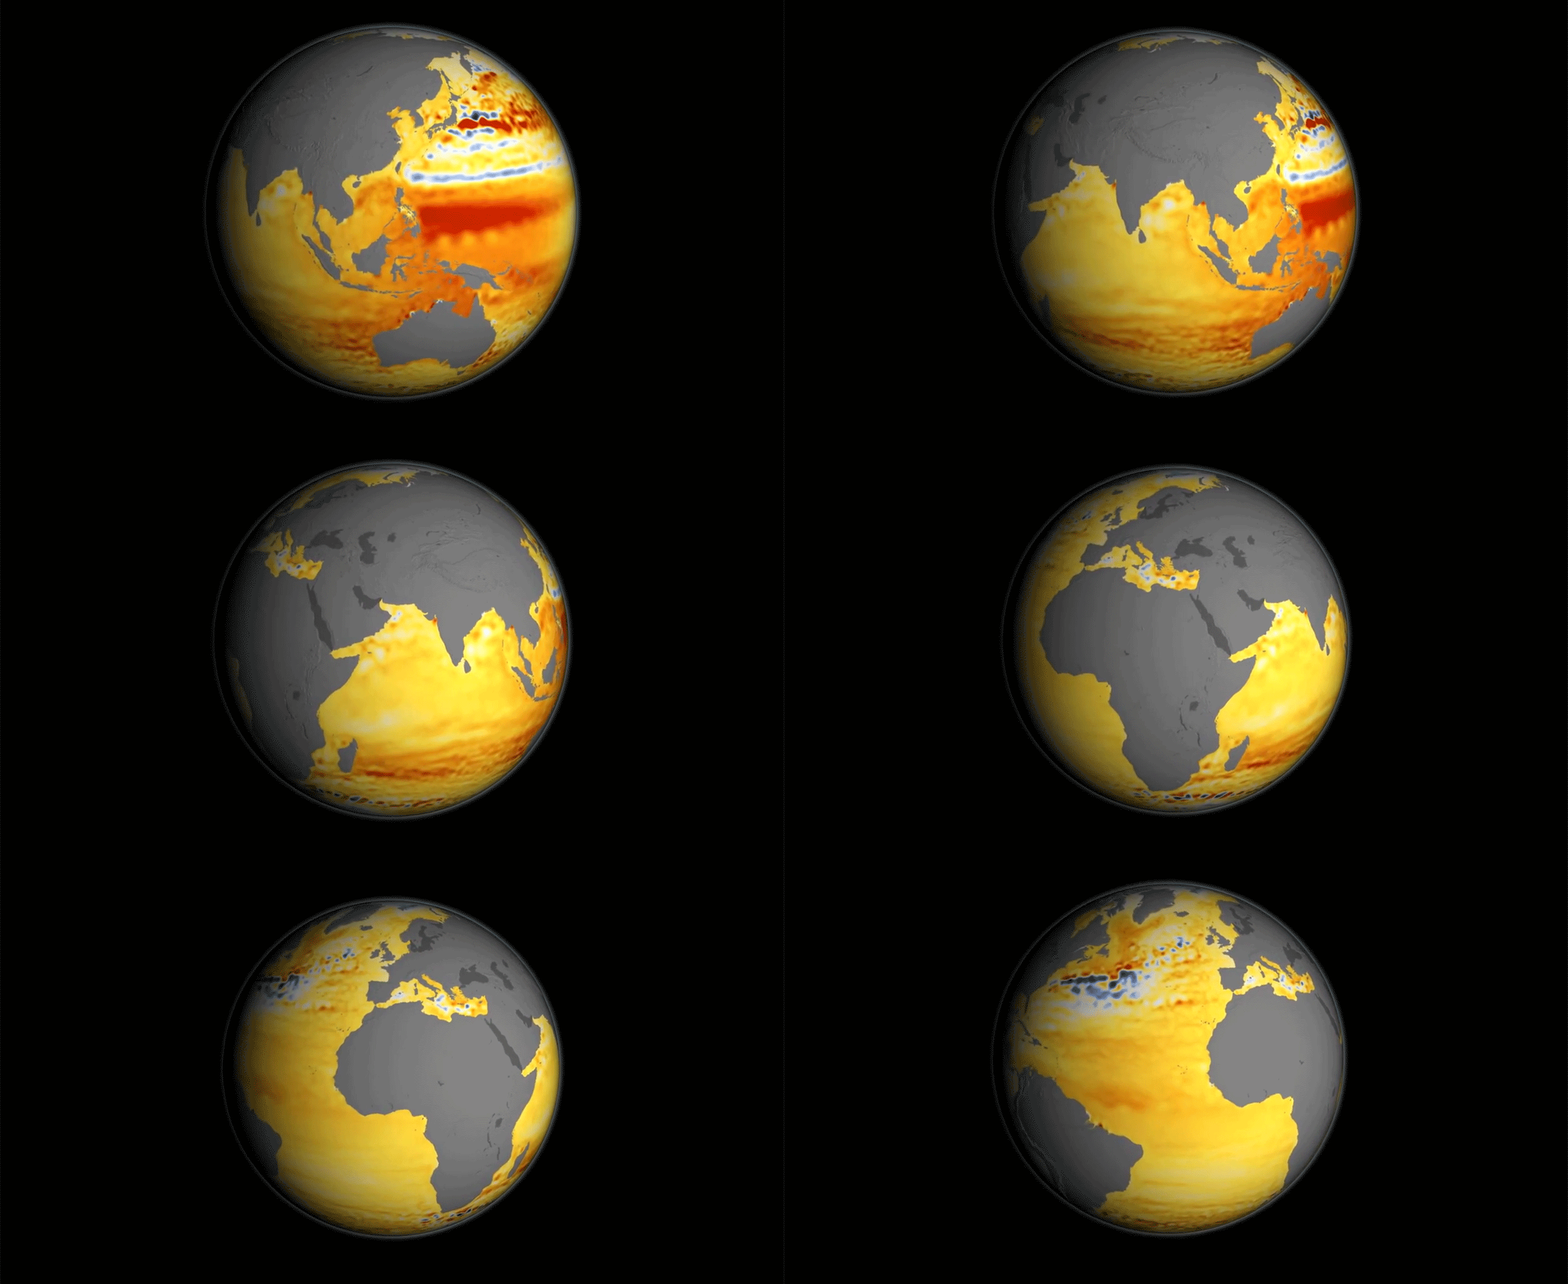
Lessons in Sea-Level Rise
What is sea-level rise and how does it affect us? This "Teachable Moment" looks at the science behind sea-level rise and offers lessons and tools for teaching students about this important climate topic.
Subject Science
Grades 5-12
Time 30-60 mins
-

Collection: Climate Change Lessons for Educators
Explore a collection of standards-aligned STEM lessons for students that get them investigating climate change along with NASA.
Student Projects
-

How Melting Ice Causes Sea Level Rise
Learn the difference between land ice and sea ice, then do an experiment to see how the melting of each contributes to global sea level rise.
Subject Science
Grades 2-8
Time 30-60 mins
-

Collection: Climate Change Activities for Students
Learn about climate change and its impacts with these projects, videos, and slideshows for students.
Articles
Explore More
Websites
- NASA Climate Change
- NASA Earth Observatory
- NASA Climate Kids
- OMG Mission Website
- NASA Sea Level Change
- NASA Cambio Climático en Español
Facts & Figures
Videos
Interactives
Image Gallery
Articles
- Climate articles from NASA
- Ask NASA Climate
- NASA People - Josh Willis, Principal Investigator, Oceans Melting Greenland
- NASA People - Earth
Podcast
TAGS: Teachable Moment, Climate, Earth Science, Glaciers, Greenland, Ice, Sea Level Rise, Teachers, Educators, Parents, Lessons, Missions, Earth, Climate TM
Edu News | April 21, 2011
Earth Day Chat for Students
Watch this 30-minute video chat where a NASA/JPL scientist answered pre-submitted student questions about Earth and climate.


